Fig. 12
Download original image
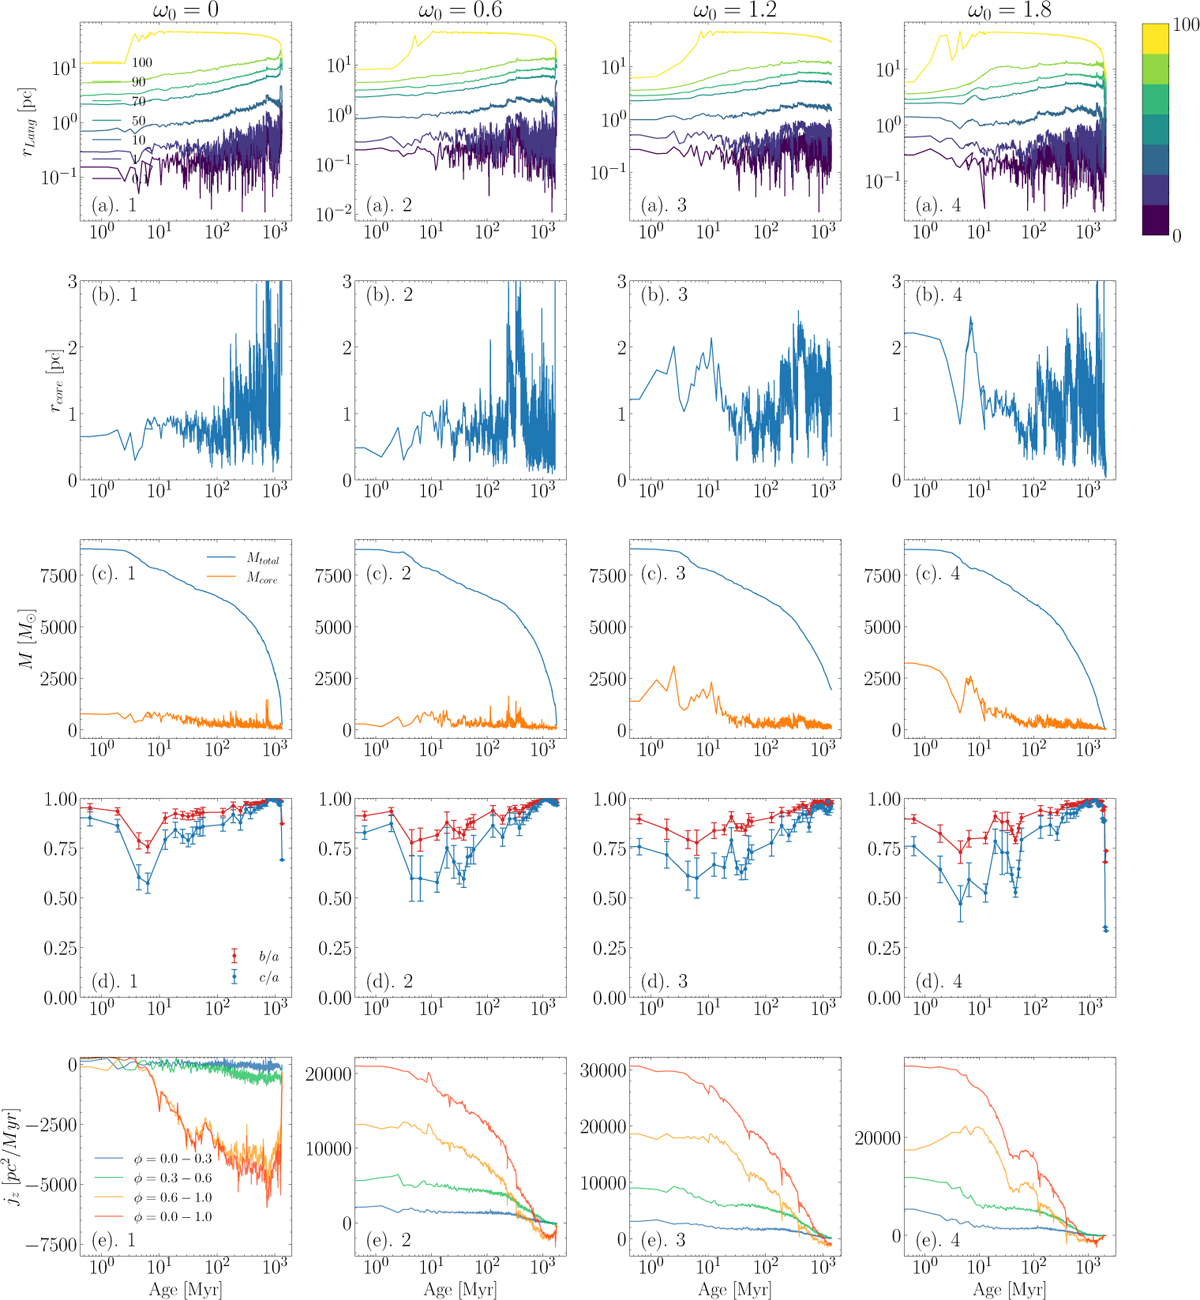
Lagrangian radii rlagr (panels (a)), core radii rcore (panels (b)), total mass Mtotal and core mass Mcore (panels (c)), principal axes ratios b/a and c/a (panels (d)), and angular momentum on the z-axis (panels (e)) of the cluster model with 15k stars, fbin = 50%, Z = 0.01, and different ω0. Rows represent respective parameters, and columns represent the initial degree of rotation. The upper row shows Lagrangian radii, where color map colors correspond to the radius of different mass percentages. The colors in the 4th row show the principal axis for the stars within one tidal radius. Colors in the bottom row show the angular momentum in z-axis for all of the stars within the inmost part (φ = 0.0-0.3), central part (φ = 0.3-0.6), outmost part (φ = 0.6-1.0), and the entire system (φ = 0.0-0.1).
Current usage metrics show cumulative count of Article Views (full-text article views including HTML views, PDF and ePub downloads, according to the available data) and Abstracts Views on Vision4Press platform.
Data correspond to usage on the plateform after 2015. The current usage metrics is available 48-96 hours after online publication and is updated daily on week days.
Initial download of the metrics may take a while.