Open Access
Fig. 11
Download original image
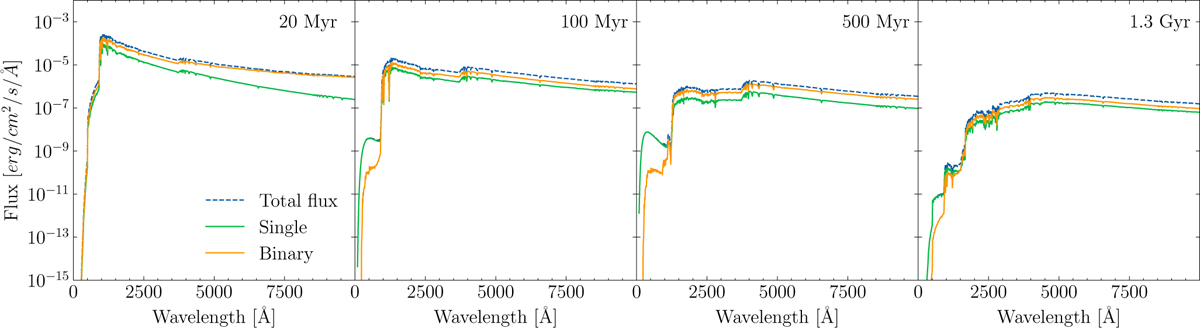
Spectral energy distributions for ages between 0Myr to 1.3 Gyr, for the model with 15k stars, fbin = 50%, Z = 0.01, and ω0 = 1.2. The colors of the curves represent the total flux, single star flux, and binary system flux as dashed blue, green, and orange lines respectively.
Current usage metrics show cumulative count of Article Views (full-text article views including HTML views, PDF and ePub downloads, according to the available data) and Abstracts Views on Vision4Press platform.
Data correspond to usage on the plateform after 2015. The current usage metrics is available 48-96 hours after online publication and is updated daily on week days.
Initial download of the metrics may take a while.