Fig. 10
Download original image
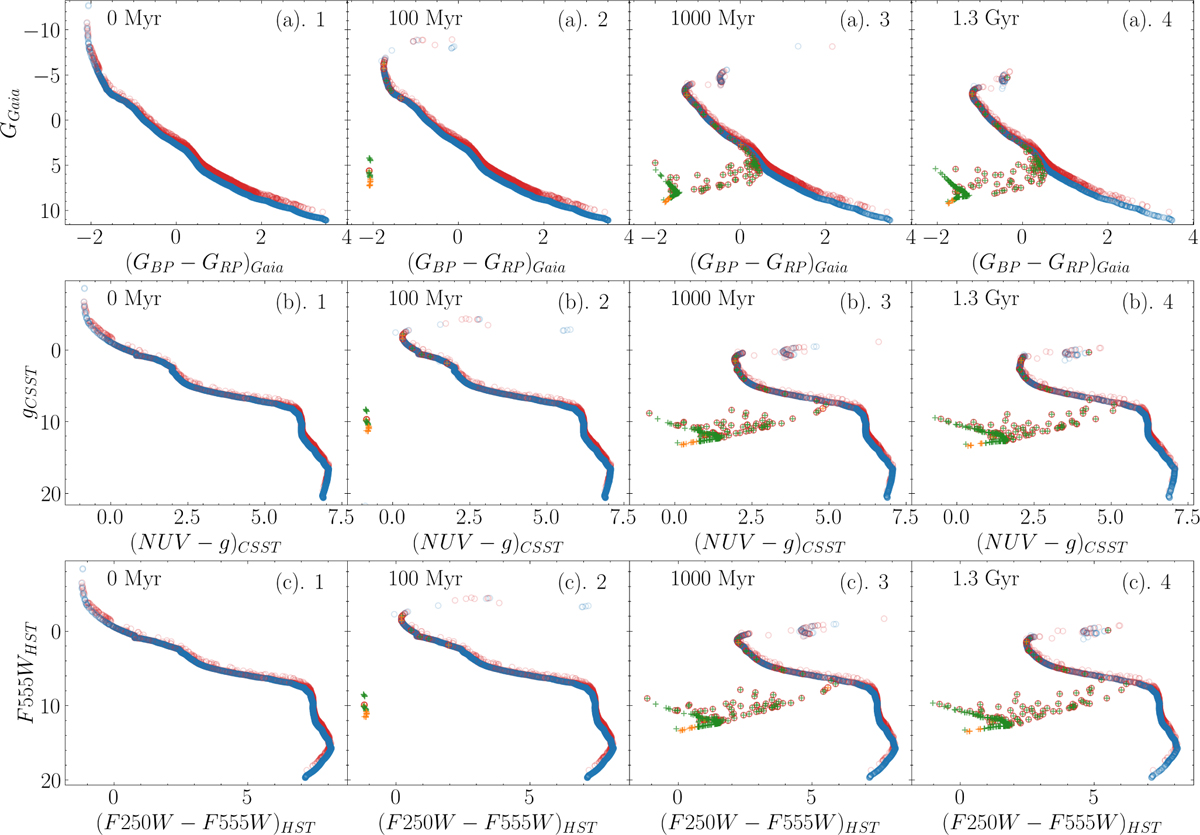
Color-magnitude diagrams for three filter bands at ages between 0 Myr to 1.3 Gyr, for the cluster model with 15k stars, fbin = 50%, Z = 0.01, and ω0 = 1.2. Rows represent CMDs for different filters. Columns represent different ages. Blue and red circles represent the magnitude of single stars and binary systems. Green and orange crosses inside the circles are the COWDs and ONWDs.
Current usage metrics show cumulative count of Article Views (full-text article views including HTML views, PDF and ePub downloads, according to the available data) and Abstracts Views on Vision4Press platform.
Data correspond to usage on the plateform after 2015. The current usage metrics is available 48-96 hours after online publication and is updated daily on week days.
Initial download of the metrics may take a while.