Open Access
Fig. 4
Download original image
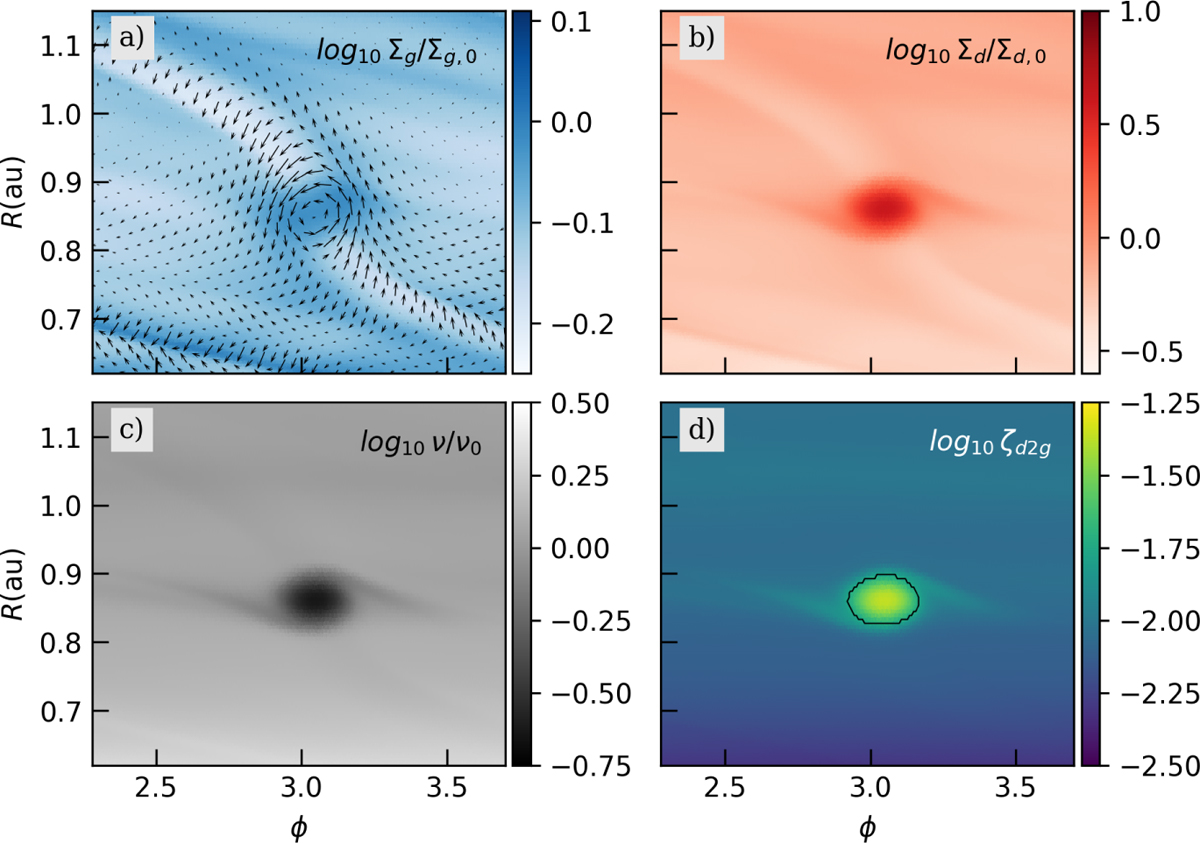
Enlarged view of an isolated vortex in model Pl_STD, showing the normalized gas and dust surface densities, as well as the viscosity and dust-to-gas surface density ratio. The arrows in the first panel show the gas velocity field. The contour in the last panel encompasses the region prone to SI.
Current usage metrics show cumulative count of Article Views (full-text article views including HTML views, PDF and ePub downloads, according to the available data) and Abstracts Views on Vision4Press platform.
Data correspond to usage on the plateform after 2015. The current usage metrics is available 48-96 hours after online publication and is updated daily on week days.
Initial download of the metrics may take a while.