Fig. 1
Download original image
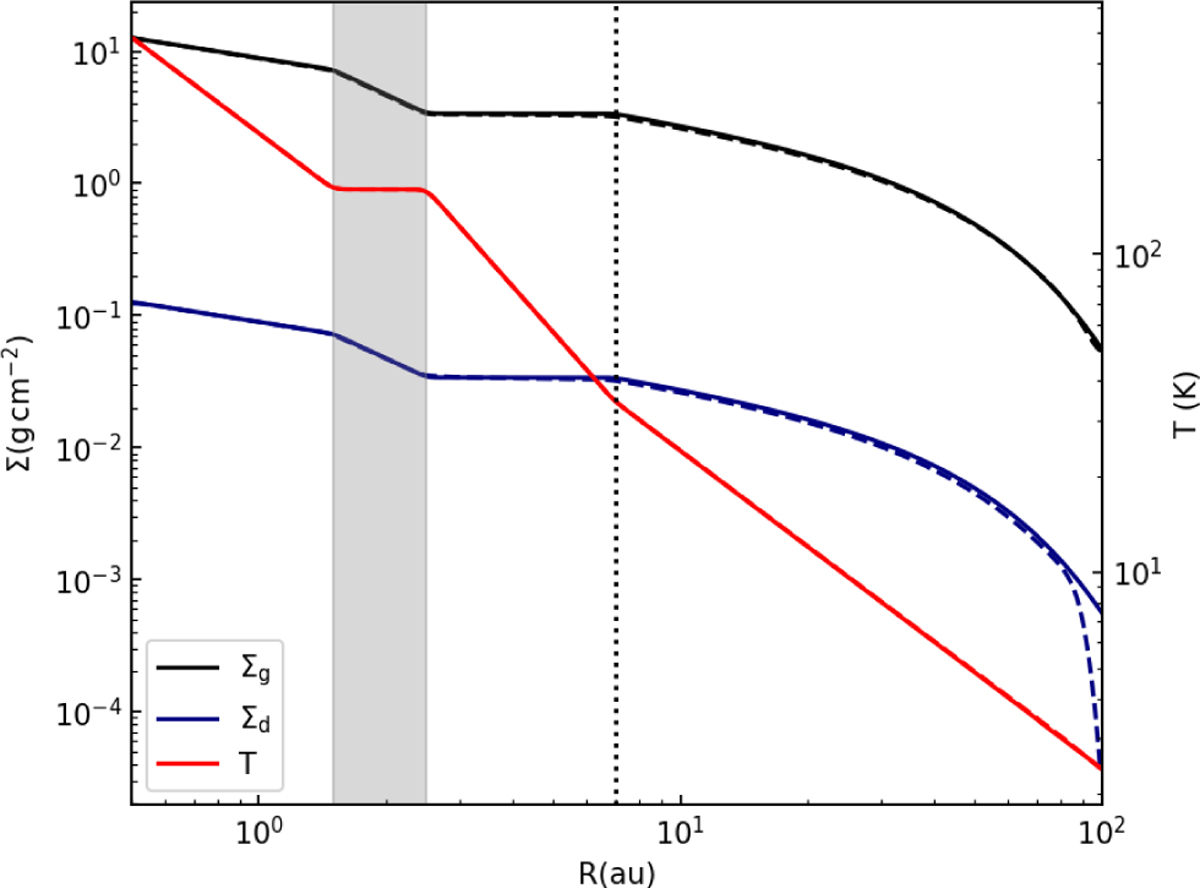
Azimuthally averaged profiles of the disk gas and dust surface density as well as the midplane temperature. The disk is evolved adiabat-ically with a constant α = 10−3 to show the pseudo-equilibrium of the initial configuration (solid lines) after 50 kyr of evolution (dashed lines). The gray band shows the water snow region. The dotted line marks Rend, outside of which an exponential taper is applied.
Current usage metrics show cumulative count of Article Views (full-text article views including HTML views, PDF and ePub downloads, according to the available data) and Abstracts Views on Vision4Press platform.
Data correspond to usage on the plateform after 2015. The current usage metrics is available 48-96 hours after online publication and is updated daily on week days.
Initial download of the metrics may take a while.