Fig. 6
Download original image
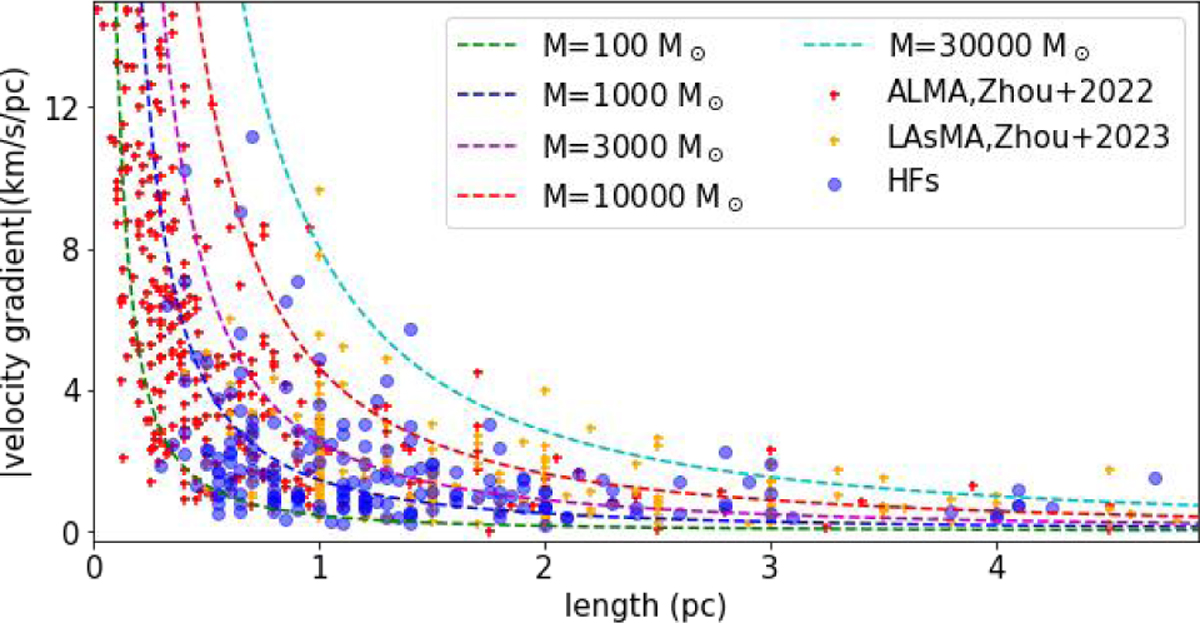
Velocity gradient versus the length over which the gradient has been fitted. Red and orange plus signs represent the velocity gradients fitted in Zhou et al. (2022) and Zhou et al. (2023), respectively. The dashed lines show free-fall velocity gradients for comparison. For the free-fall model, from left to right, the lines denote masses of 100 M⊙, 1000 M⊙, 3000 M⊙, 10 000 M⊙, and 30 000 M⊙.
Current usage metrics show cumulative count of Article Views (full-text article views including HTML views, PDF and ePub downloads, according to the available data) and Abstracts Views on Vision4Press platform.
Data correspond to usage on the plateform after 2015. The current usage metrics is available 48-96 hours after online publication and is updated daily on week days.
Initial download of the metrics may take a while.