Fig. 4.
Download original image
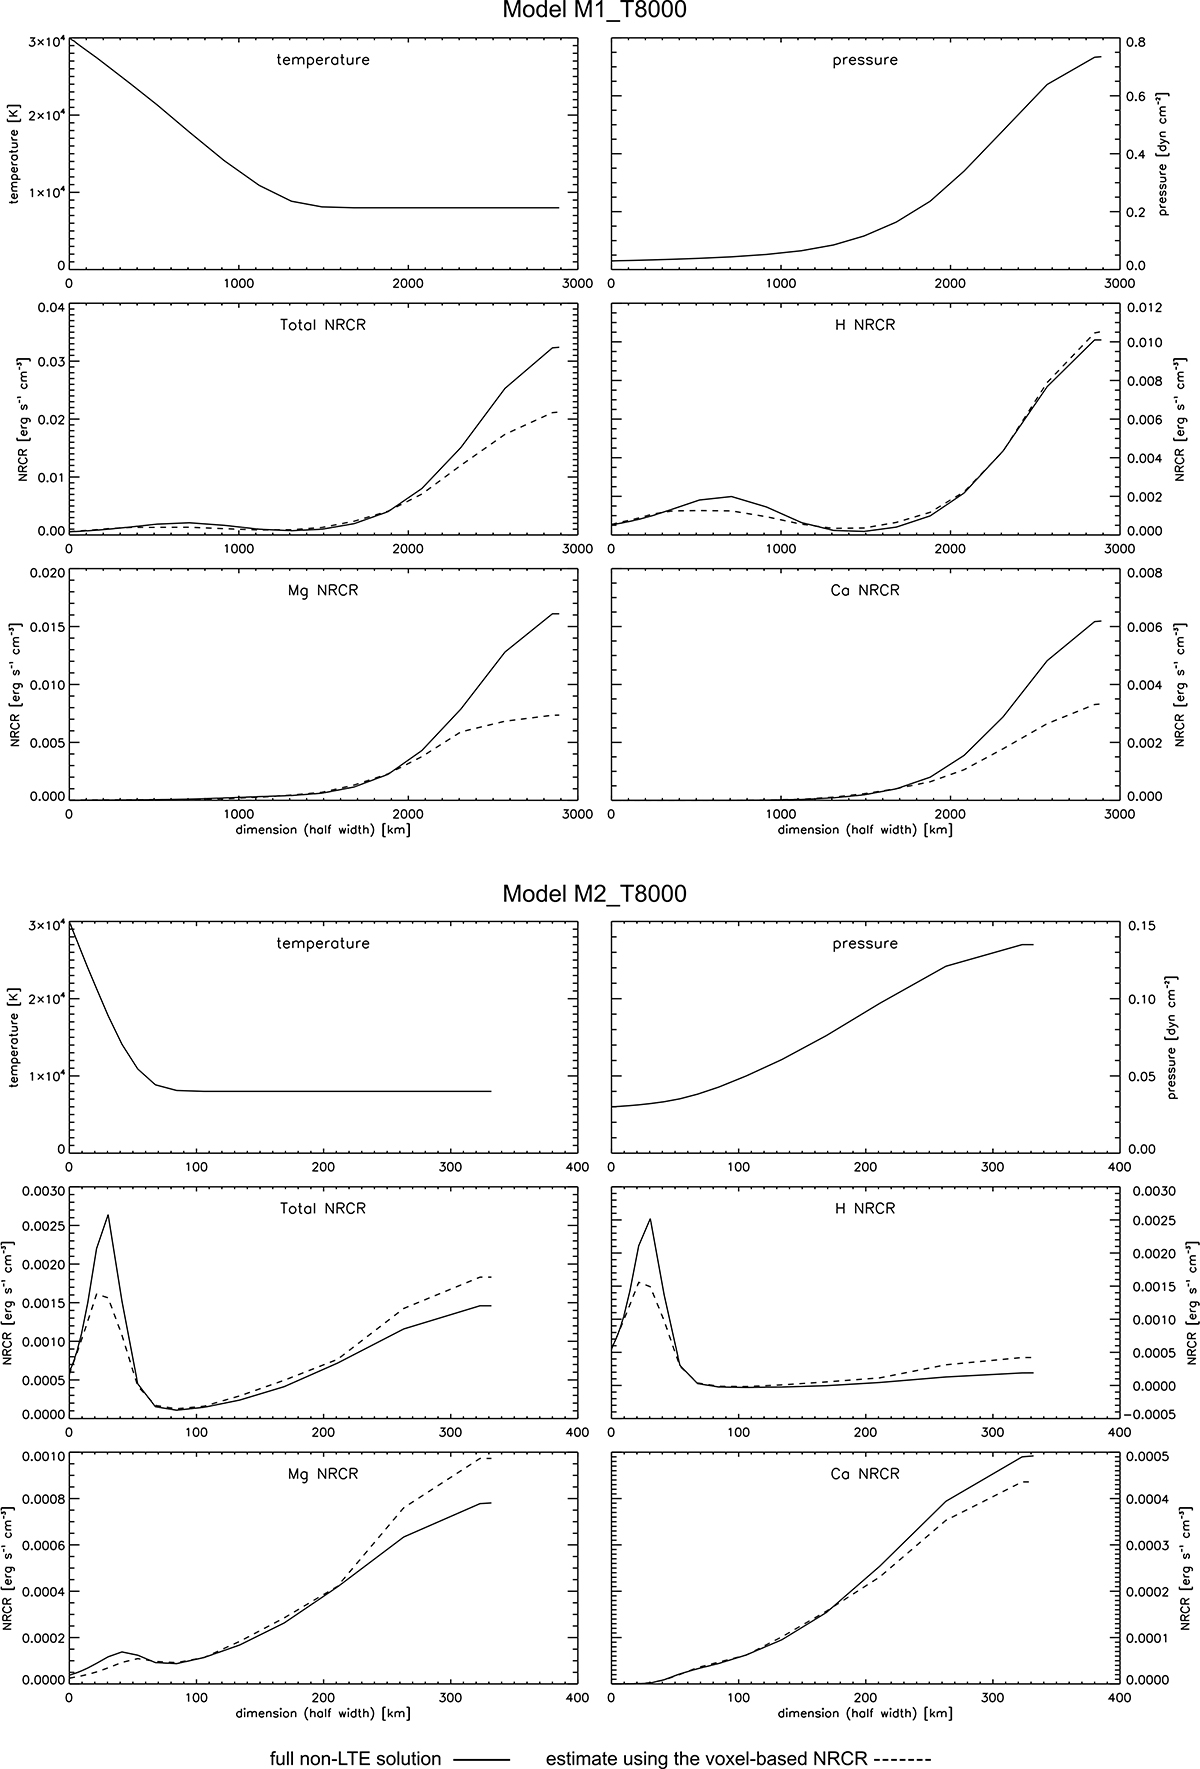
Comparison of NRCRs derived by solving non-LTE radiative transfer and estimated, voxel-based NRCRs. The top six panels correspond to the model M1_T8000 and the bottom six panels to model M2_T8000. For both models, the first row of panels shows the variation in the temperature (left) and pressure (right) across one half of the symmetrical slab. The second row shows the total NRCRs (left) and hydrogen NRCRs (right). The third row shows the Mg II (left) and Ca II NRCRs (right). The voxel-based NRCR curves are plotted using dashed lines, while the non-LTE solution is plotted using the solid lines.
Current usage metrics show cumulative count of Article Views (full-text article views including HTML views, PDF and ePub downloads, according to the available data) and Abstracts Views on Vision4Press platform.
Data correspond to usage on the plateform after 2015. The current usage metrics is available 48-96 hours after online publication and is updated daily on week days.
Initial download of the metrics may take a while.