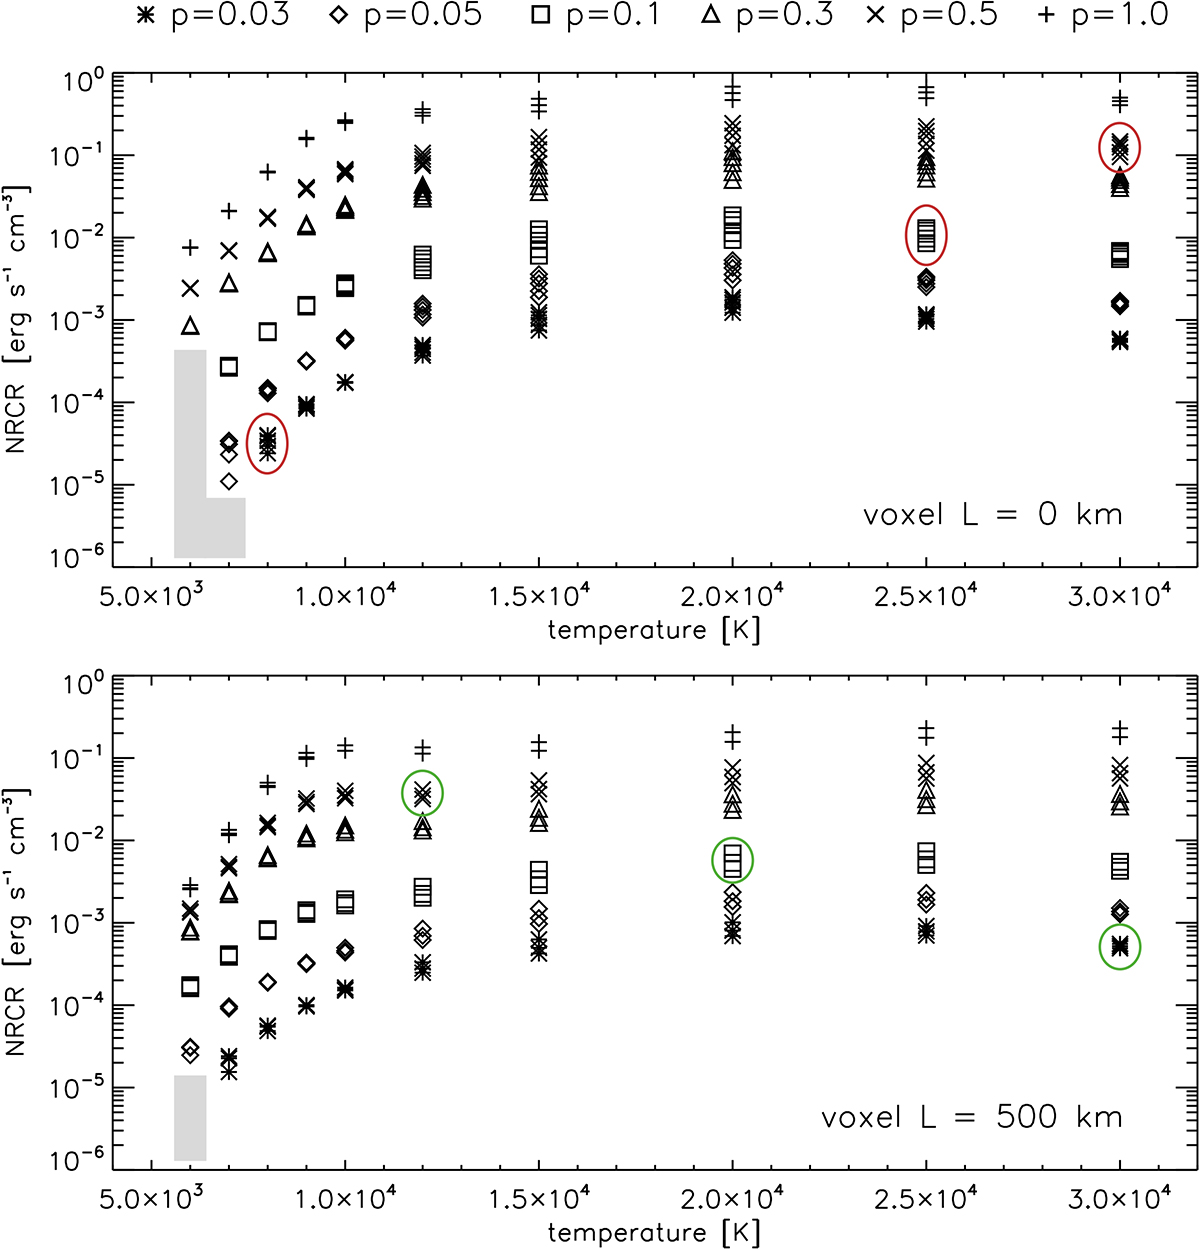
Fig. 3.

Download original image
Example of the total NRCRs in voxels with the distance from the nearest illuminated surface, L, of 0 and 500 km. The plots show all models from the grid. The temperature is given on the x-axis, and the pressure is indicated by the symbols. The asterisk (Λ) corresponds to 0.03 dyn cm−2, the diamond (♢) to 0.05 dyn cm−2, the square (□) to 0.1 dyn cm−2, the triangle (▵) to 0.3 dyn cm−2, the cross (×) to 0.5 dyn cm−2, and the plus sign (+) to 1.0 dyn cm−2. In each panel, we plot NRCR values from the 1D vertical slab models with all widths (500, 1000, 2000, 5000, and 10 000 km). The clusters of symbols (as indicated by the red and green ellipses) indicate the spread of the NRCR values from models with identical T and p but with different widths. Note that the voxel with L = 0 km is present in the models with all widths. The voxel with L = 500 km is present only in the models with widths of 2000, 5000, and 10 000 km. The seemingly missing data points in the grey zones are lower than the plotted range and are mostly negative. Negative NRCR values correspond to radiative gains.
Current usage metrics show cumulative count of Article Views (full-text article views including HTML views, PDF and ePub downloads, according to the available data) and Abstracts Views on Vision4Press platform.
Data correspond to usage on the plateform after 2015. The current usage metrics is available 48-96 hours after online publication and is updated daily on week days.
Initial download of the metrics may take a while.


