Fig. C.1.
Download original image
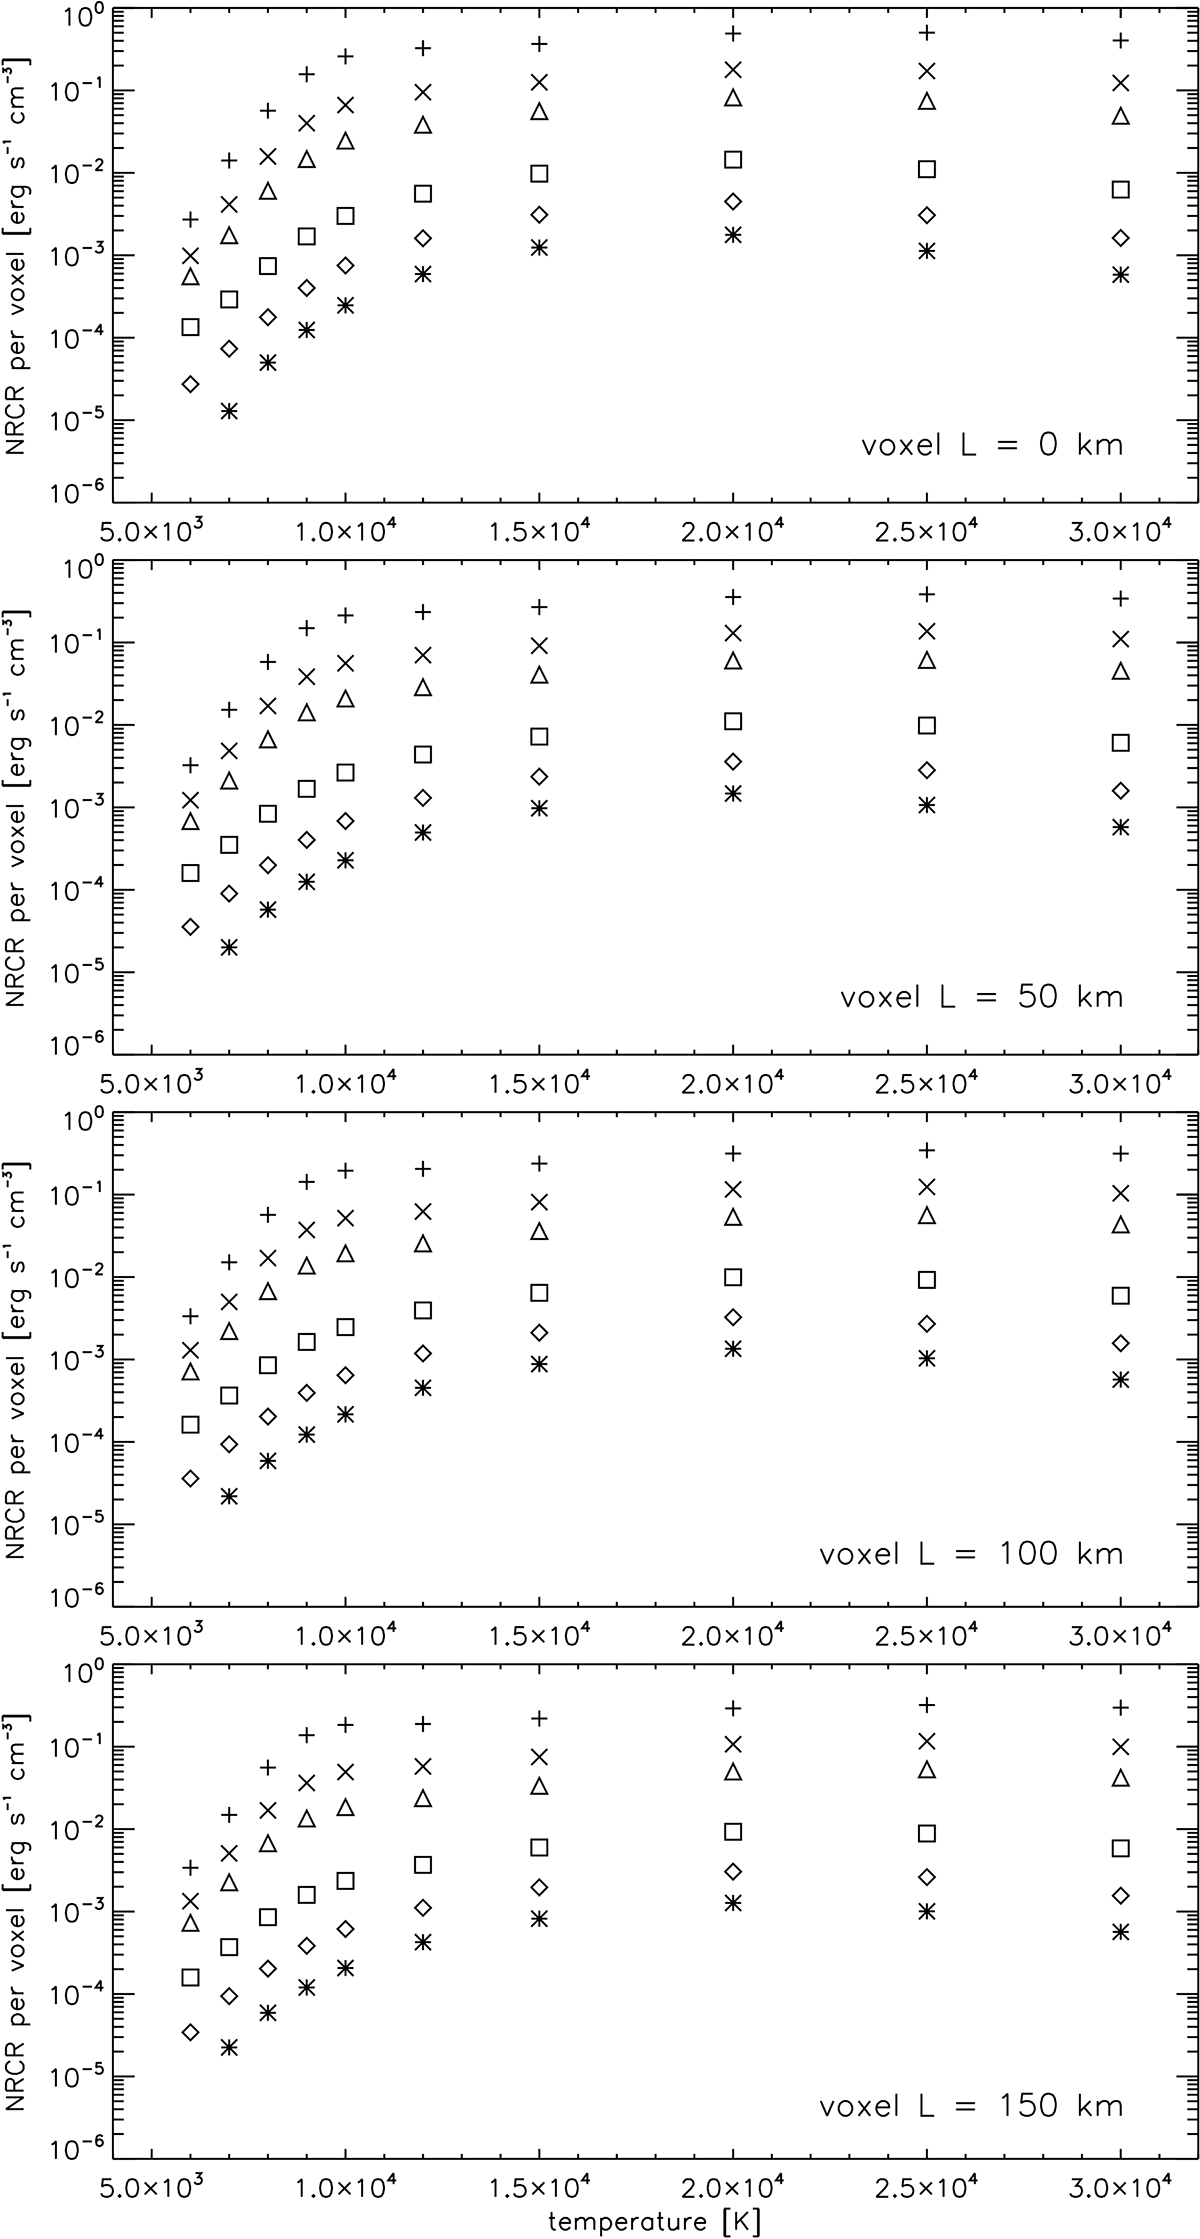
Total NRCRs in voxels with L of 0, 50, 100, and 150 km for the top part of 1D horizontal models (Tables C.1 and C.2). The temperature is given on the x-axis and the pressure is indicated by the symbols. Asterisks corresponds to 0.03 dyn cm−2, diamonds to 0.05 dyn cm−2, squares to 0.1 dyn cm−2, triangles to 0.3 dyn cm−2, crosses to 0.5 dyn cm−2, and plus signs to 1.0 dyn cm−2. The seemingly missing data points in the grey zones are lower than the plotted range and are mostly negative. Negative NRCR values correspond to radiative gains.
Current usage metrics show cumulative count of Article Views (full-text article views including HTML views, PDF and ePub downloads, according to the available data) and Abstracts Views on Vision4Press platform.
Data correspond to usage on the plateform after 2015. The current usage metrics is available 48-96 hours after online publication and is updated daily on week days.
Initial download of the metrics may take a while.