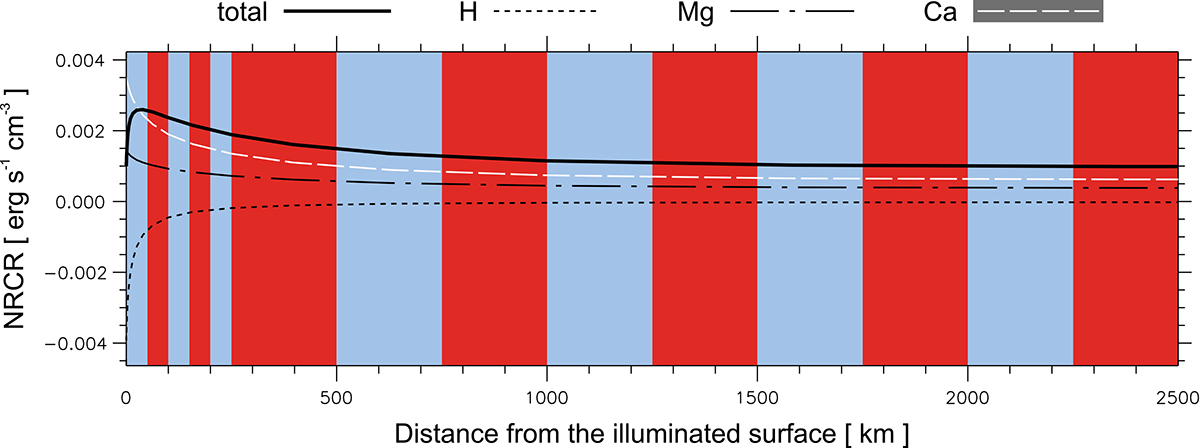
Fig. 1.
Download original image
Illustration of NRCRs as a function of the distance from the illuminated surface. Only one half (left) of the model width is shown (the model is symmetric). The plotted NRCR values correspond to a 1D vertical slab model with T = 6000 K and p = 0.5 dyn cm−2. The full line shows the total NRCRs derived as a sum of hydrogen (short-dashed black line), Mg II (dash-dotted black line), and Ca II (long-dashed white line) NRCRs. The blue and red stripes represent the voxels. The first five voxels have sizes of 50 km, and the rest have sizes of 250 km.
Current usage metrics show cumulative count of Article Views (full-text article views including HTML views, PDF and ePub downloads, according to the available data) and Abstracts Views on Vision4Press platform.
Data correspond to usage on the plateform after 2015. The current usage metrics is available 48-96 hours after online publication and is updated daily on week days.
Initial download of the metrics may take a while.