Fig. 8.
Download original image
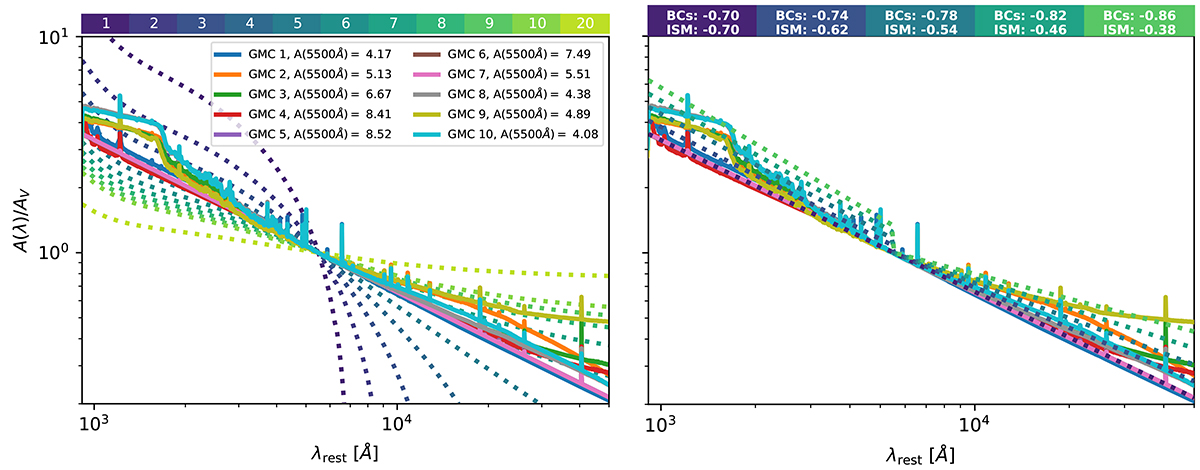
Attenuation curves normalized at A(λ)/AV = 1 when λ = 5500 Å over wavelength in the rest frame, as derived by GalaPy SED fittings. The A(λ) value at 5500 Å is labeled in the legend of the left panel in linear scale and per GMC. This legend also indicates the color corresponding to each GMC in the solid lines. Curves based on RV values according to the methodology of Calzetti et al. (2000) are included for comparison (as dotted curves) in the left panel, following the colorbar. On the other hand, the dotted curves on the right panel show the attenuation curves from the models of Charlot & Fall (2000), which differentiate between young and old stellar populations, providing different exponential factors to the attenuation coming from birth clouds (BCs) and the ISM (ISM), related to these populations (see Sect. 4.2.2), which are labeled in the colorbar.
Current usage metrics show cumulative count of Article Views (full-text article views including HTML views, PDF and ePub downloads, according to the available data) and Abstracts Views on Vision4Press platform.
Data correspond to usage on the plateform after 2015. The current usage metrics is available 48-96 hours after online publication and is updated daily on week days.
Initial download of the metrics may take a while.