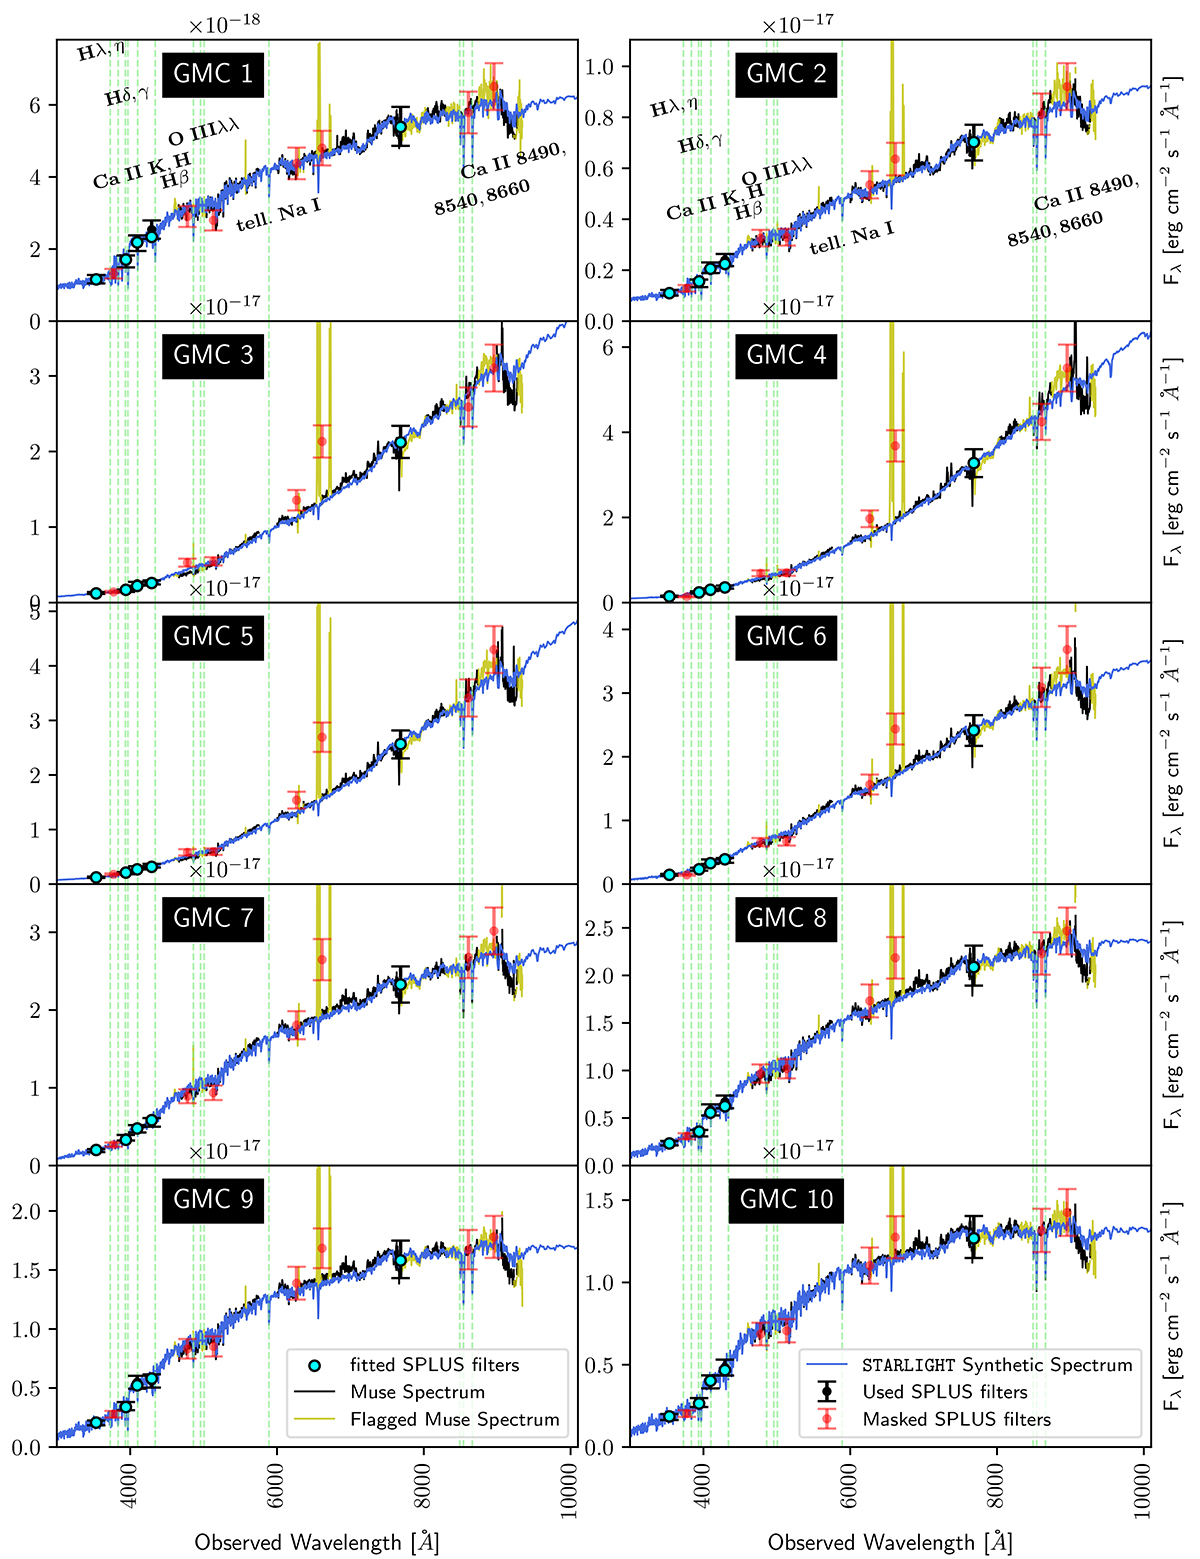
Fig. 5.
Download original image
STARLIGHT fits (shown by blue lines) are applied to the MUSE spectra (represented in black, with yellow lines indicating masked data) along with S-PLUS photometry fits (depicted with black and red circles, depending on whether they were used in the fit, with red points marking the masked data, and cyan points for the S-PLUS photometric data fitted by STARLIGHT). Vertical dashed lines indicate the position of the stellar features labeled in the top panels.
Current usage metrics show cumulative count of Article Views (full-text article views including HTML views, PDF and ePub downloads, according to the available data) and Abstracts Views on Vision4Press platform.
Data correspond to usage on the plateform after 2015. The current usage metrics is available 48-96 hours after online publication and is updated daily on week days.
Initial download of the metrics may take a while.