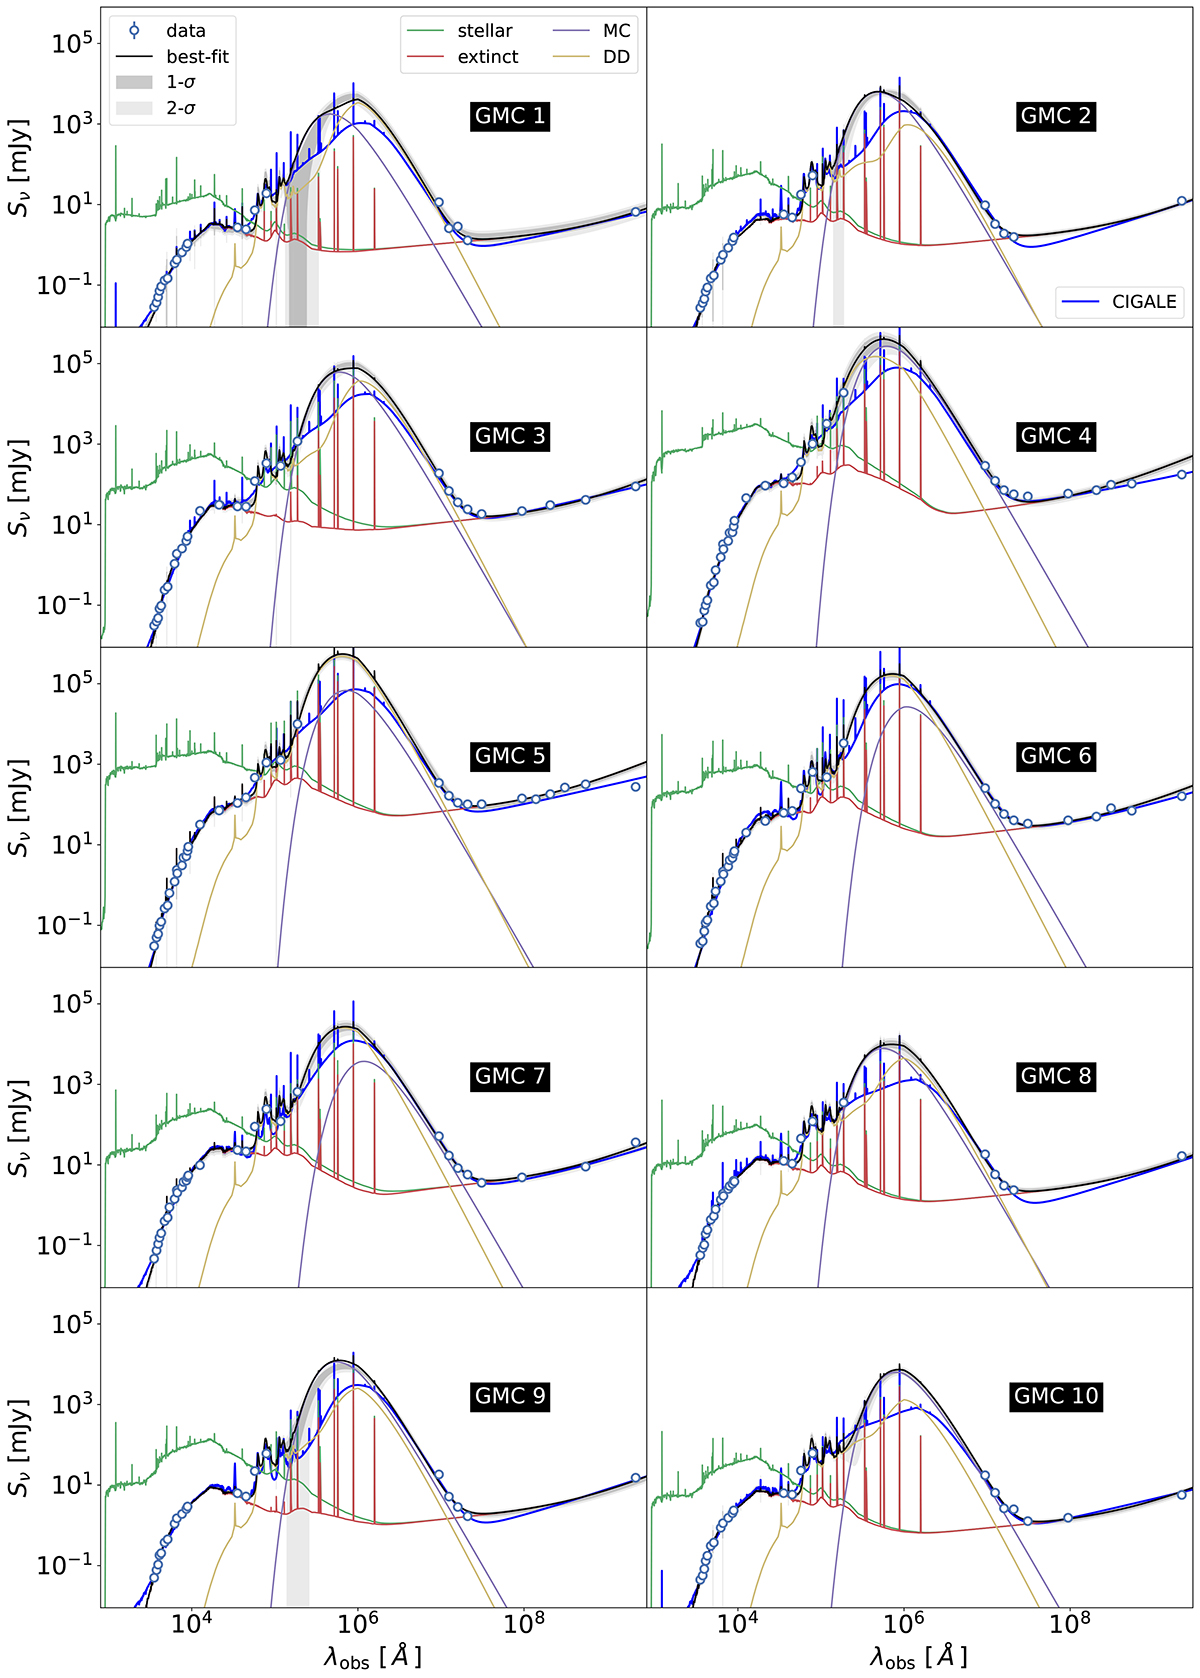
Fig. 3.
Download original image
SED models obtained with the GalaPy software for the ten GMCs studied in this work, each of them covering a diameter of 3″ (∼50 pc; see Sect. 3.1). Points correspond to the photometric measurements obtained from the sample (Sects. 2 and 4.1), while solid lines correspond to the unattenuated stellar emission (green), molecular cloud component (MC, purple), stellar emission considering extinction (extinct, red), and diffuse dust (DD, yellow). Best-fitting modeling results from CIGALE, devoid of an AGN component, are overlaid as solid blue lines (see also Fig. A.1 for a detailed view). Detailed information about the CIGALE modeling is given in Appendix A.
Current usage metrics show cumulative count of Article Views (full-text article views including HTML views, PDF and ePub downloads, according to the available data) and Abstracts Views on Vision4Press platform.
Data correspond to usage on the plateform after 2015. The current usage metrics is available 48-96 hours after online publication and is updated daily on week days.
Initial download of the metrics may take a while.