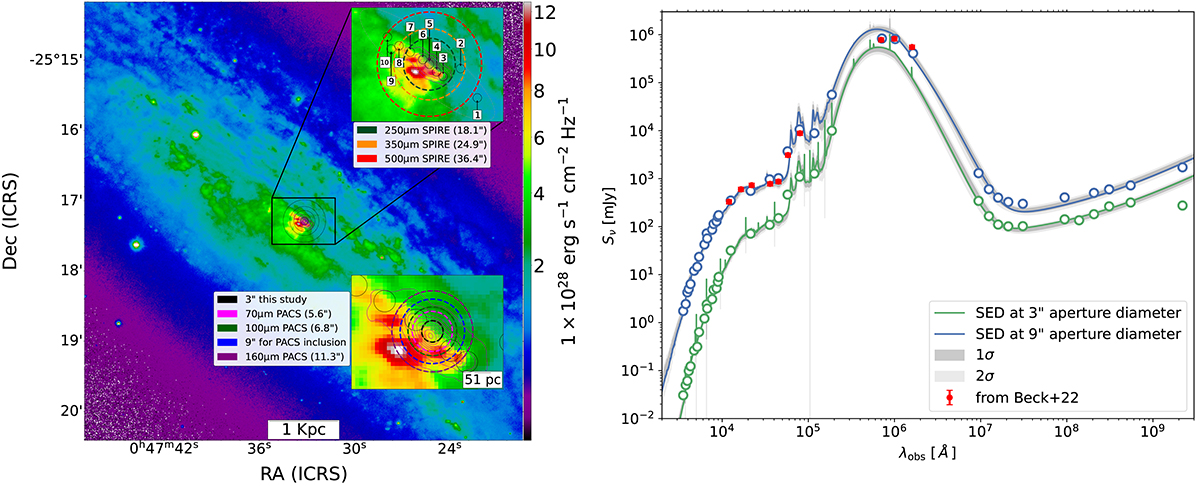
Fig. E.1.
Download original image
Testing the far infrared bump with Herschel PACS instruments. Left: Flux density of the S-PLUS R-filter band following the levels indicated in the colorbar. The two insets provide a closer look into the inner regions, where the CMZ is located. The upper inset shows the ten GMCs studied in this work, along with the ellipses where Lindblad resonances were detected by Iodice et al. (2014). The labeled apertures show how coarse (factor of 6–12 compared to the 3″ aperture used in this work) the angular resolution of Herschel SPIRE is from tracing our observations. The bottom inset performs a further 40% zooming on the nuclear regions, with Herschel PACS instrument apertures overlaid on the regions, and showing how GMCs 3 to 6 are partially or fully covered at 70, 100, and 160 μm observations beams. The contours show the L-band VLA observations (1.4 GHz) to indicate the maximum extent at which the rightmost point in our SEDs, namely, the largest wavelength, is available. Right: Visualization of Herschel PACS apertures and SED combined results. 3 and 9″ aperture SEDs obtained by GalaPy and centered at the GMC 5 position are in green and blue, respectively. We note that 6″ and 9″-aperture-extracted SED do not vary significantly (6″ SED is not shown) indicating that HST, VLT, and ALMA observations correspond to the central emission that does not increment with larger apertures. We consider only the 9″-aperture-extracted SED for comparison with the 3″ one as it better covers Herschel PACS observations at 70 and 100 μm bands, whose respective angular resolutions are of 5.6″ and 6.8″. Red points with an assumed 10% uncertainty correspond to the dataset used in Beck et al. (2022), their Table 4, to produce the SED of their Fig. 8, excluding GALEX observations as we have not used UV information for this work.
Current usage metrics show cumulative count of Article Views (full-text article views including HTML views, PDF and ePub downloads, according to the available data) and Abstracts Views on Vision4Press platform.
Data correspond to usage on the plateform after 2015. The current usage metrics is available 48-96 hours after online publication and is updated daily on week days.
Initial download of the metrics may take a while.