Fig. 2.
Download original image
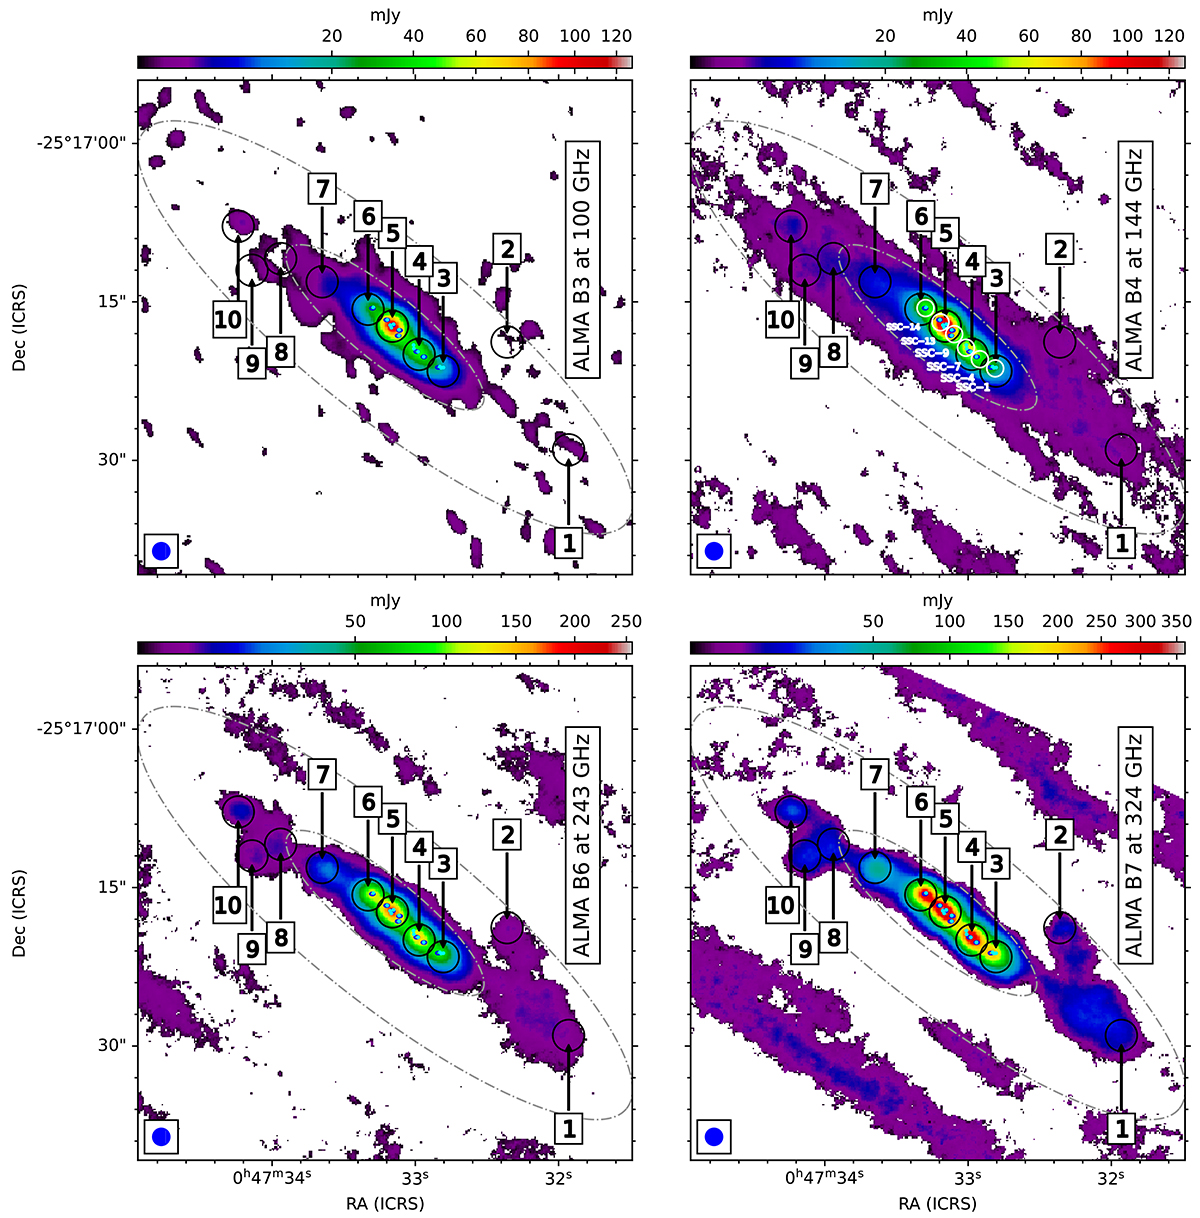
Integrated intensity maps of NGC 253’s CMZ showing its ten GMCs at the central frequencies of ALMA bands 3, 4, 6, and 7 (i.e., at 100, 144, 243, and 324 GHz). Data from ALMA band 5 are not shown as its central frequency of 187 GHz is strongly affected by telluric absorption from a water line at ∼183 GHz, as can be inferred from Fig. 1. The ALCHEMI 1![]() 6 beam is depicted at the bottom left corner of each panel. 3″ apertures where the photometric points have been extracted are shown at each of the ten GMC positions as black circles (see Table 1). Each continuum map shows the eight dusty star-forming clouds detected by Ando et al. (2017) in blue and the 14 super star clusters identified by Rico-Villas et al. (2020) in cyan. Additionally, for the ALMA B4 continuum map, we label the six super star clusters (SSC) at 1
6 beam is depicted at the bottom left corner of each panel. 3″ apertures where the photometric points have been extracted are shown at each of the ten GMC positions as black circles (see Table 1). Each continuum map shows the eight dusty star-forming clouds detected by Ando et al. (2017) in blue and the 14 super star clusters identified by Rico-Villas et al. (2020) in cyan. Additionally, for the ALMA B4 continuum map, we label the six super star clusters (SSC) at 1![]() 6 resolution studied by Butterworth et al. (2024). The color bar is in units of mJy, scaled by powers of the square-root of two,
6 resolution studied by Butterworth et al. (2024). The color bar is in units of mJy, scaled by powers of the square-root of two, ![]() , with n starting from the 85th percentile up to the maximum emission value. Ellipses show the limits of the inner Lindblad resonances as determined by Iodice et al. (2014). Numbers indicate the different GMCs as firstly identified and numbered by Leroy et al. (2015) but with most positions taken from Harada et al. (2024) (see Sect. 2.7 for details).
, with n starting from the 85th percentile up to the maximum emission value. Ellipses show the limits of the inner Lindblad resonances as determined by Iodice et al. (2014). Numbers indicate the different GMCs as firstly identified and numbered by Leroy et al. (2015) but with most positions taken from Harada et al. (2024) (see Sect. 2.7 for details).
Current usage metrics show cumulative count of Article Views (full-text article views including HTML views, PDF and ePub downloads, according to the available data) and Abstracts Views on Vision4Press platform.
Data correspond to usage on the plateform after 2015. The current usage metrics is available 48-96 hours after online publication and is updated daily on week days.
Initial download of the metrics may take a while.