Open Access
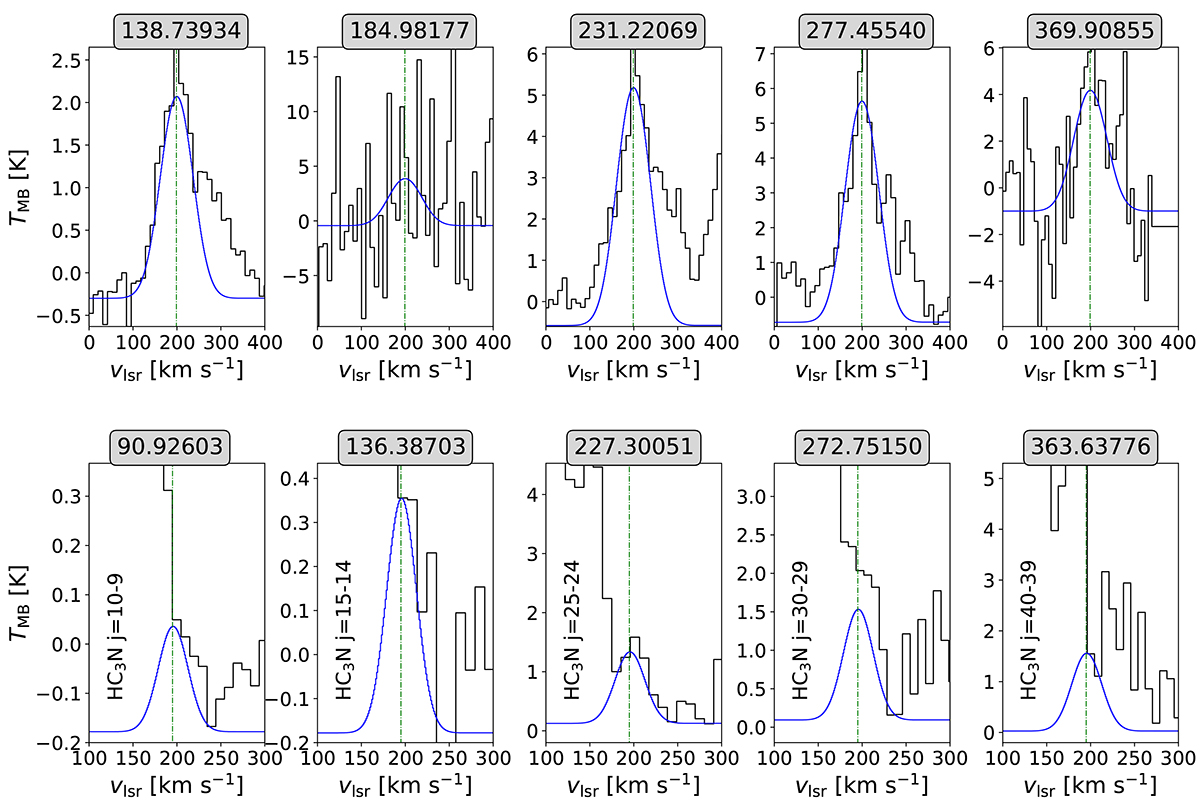
Fig. C.1.
Download original image
Top panel: 13CS. Bottom panel: 13C34S. Frequencies, in GHz, are labeled at the top of each sub-panel. Best-fit VLSR values (see Table C.1) are indicated by green-dashed vertical lines. The HC3N blending feature is indicated to the left of each 13CS transition.
Current usage metrics show cumulative count of Article Views (full-text article views including HTML views, PDF and ePub downloads, according to the available data) and Abstracts Views on Vision4Press platform.
Data correspond to usage on the plateform after 2015. The current usage metrics is available 48-96 hours after online publication and is updated daily on week days.
Initial download of the metrics may take a while.