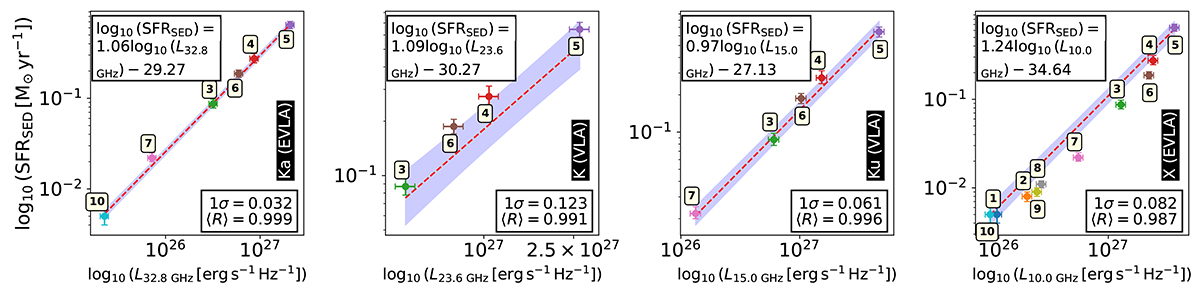
Fig. 13.
Download original image
SFR from our SED fitting using GalaPy versus fluxes from our retrieved (E)VLA continuum images, using apertures of 3″ in available GMCs (see Table 2). Best-fit linear regressions in the logarithmic scale are indicated in the top leftmost corners of each subplot, this best-fit is indicated with a dashed red line. The 1σ dispersion from the best fit to the different measurements is indicated in the bottom right corners of each subplot and also as shaded blue areas around the linear regression. (E)VLA band names are labeled with black background legends. GMCs are numbered and also color-coded following legend in Fig. D.1. We assume a conservative 10% flux uncertainty for (E)VLA observations.
Current usage metrics show cumulative count of Article Views (full-text article views including HTML views, PDF and ePub downloads, according to the available data) and Abstracts Views on Vision4Press platform.
Data correspond to usage on the plateform after 2015. The current usage metrics is available 48-96 hours after online publication and is updated daily on week days.
Initial download of the metrics may take a while.