Fig. 10.
Download original image
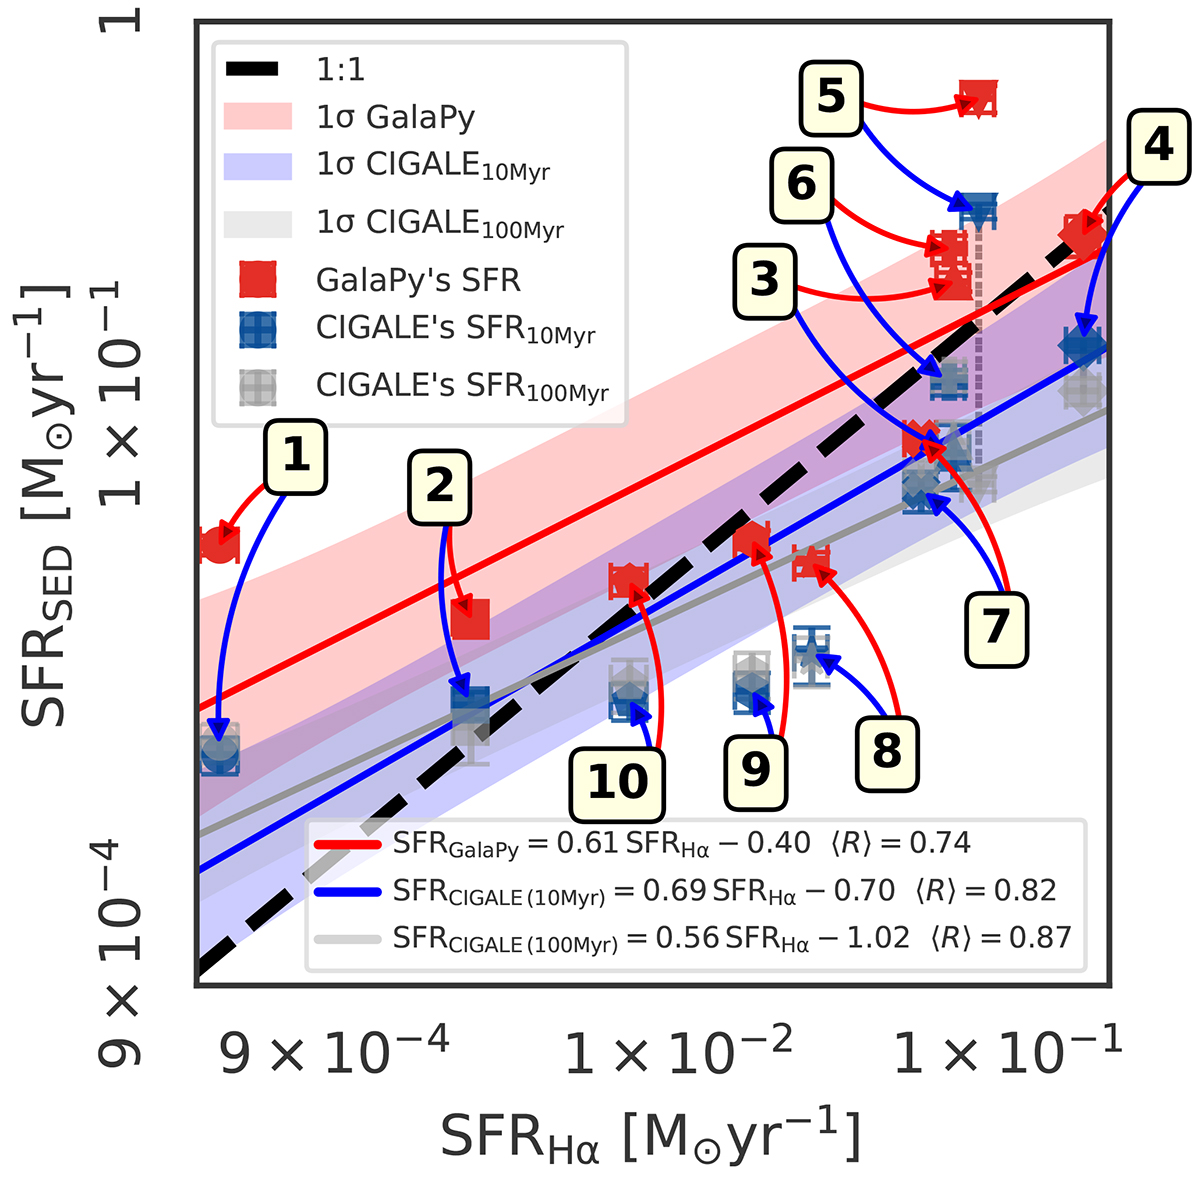
Star formation rate (SFR) obtained from Hα, SFRHα, following Eq. (5) versus the ones obtained from our SED fittings using GalaPy (red points; SFR in Table 5) and CIGALE (blue points; SFR10 Myr in Table 6), following the legend. The numbers correspond to the identification of the GMCs. Shaded areas indicate the 1σ dispersion for GalaPy (red) and CIGALE (SFRs averaged over 10 Myr in blue and over 100 Myr in gray) datapoints. The dashed black line shows the 1:1 expected correlation (Kennicutt 1998). The SFR obtained from the Hα emission line has been corrected by Balmer inferred attenuations ![]() listed in Table 8, which already incorporates a correction of ×0.82 (see Subsect. 4.2.2). Gray symbols are CIGALE’s SFRs averaged over 100 Myr, they are connected by dots to the CIGALE’s SFR10 Myr (only noticeable for the GMC 5 case). Best fits and correlation coefficients are shown in the bottom legend.
listed in Table 8, which already incorporates a correction of ×0.82 (see Subsect. 4.2.2). Gray symbols are CIGALE’s SFRs averaged over 100 Myr, they are connected by dots to the CIGALE’s SFR10 Myr (only noticeable for the GMC 5 case). Best fits and correlation coefficients are shown in the bottom legend.
Current usage metrics show cumulative count of Article Views (full-text article views including HTML views, PDF and ePub downloads, according to the available data) and Abstracts Views on Vision4Press platform.
Data correspond to usage on the plateform after 2015. The current usage metrics is available 48-96 hours after online publication and is updated daily on week days.
Initial download of the metrics may take a while.