Open Access
Fig. 5
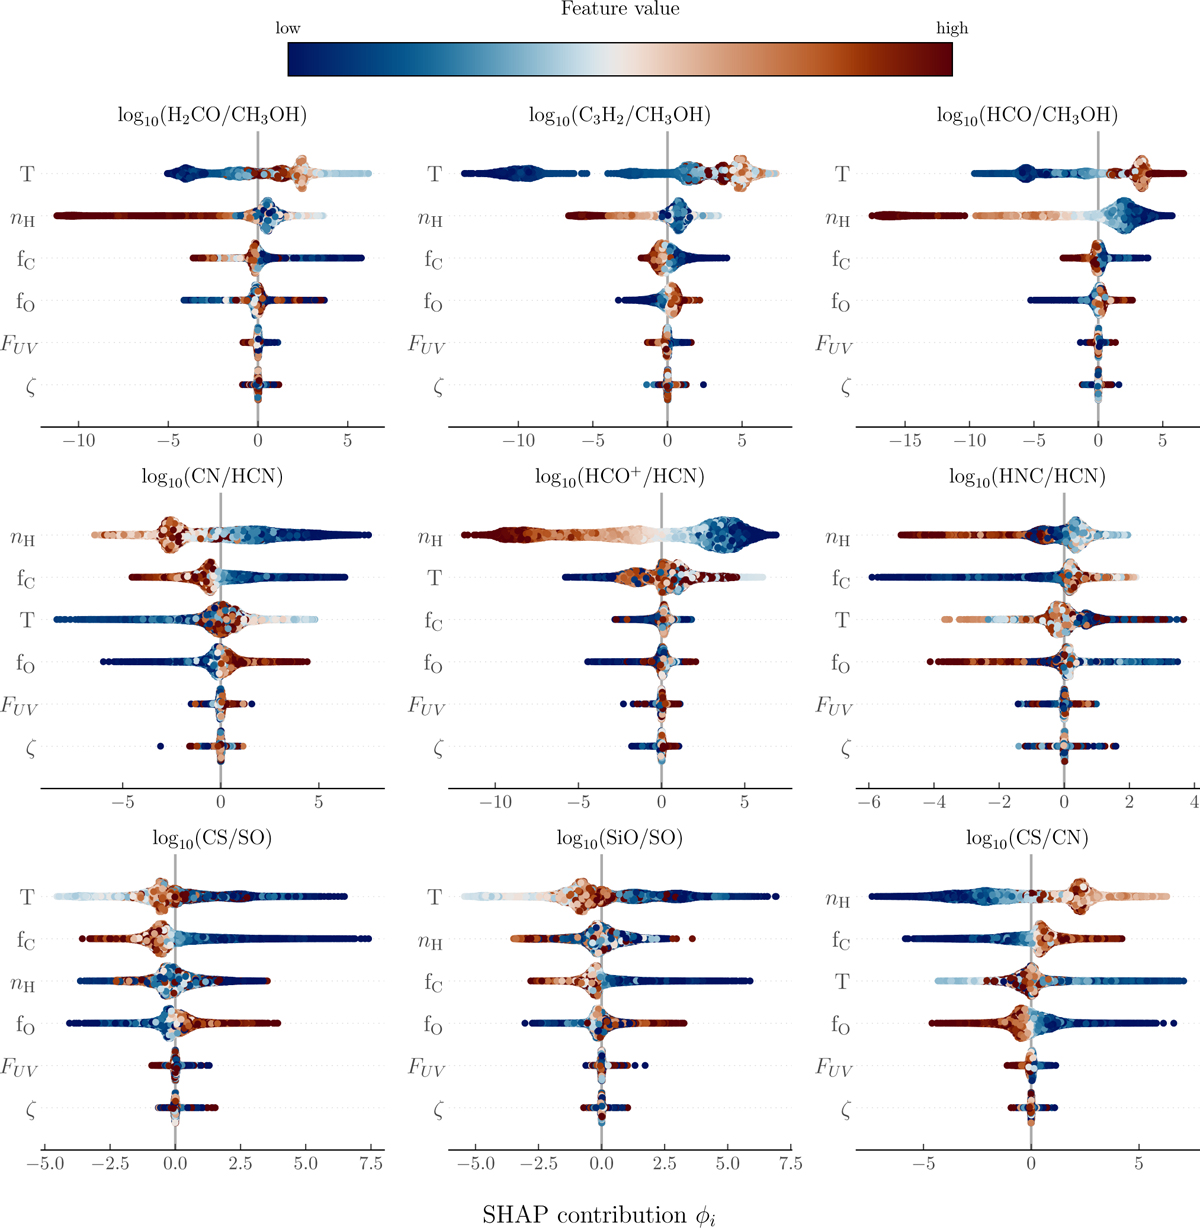
Download original image
All of the SHAP values for each of the ratios. The features are sorted by mean absolute impact as shown in Figure 4. Every color map is normalized to the detectable range for each individual feature per ratio.
Current usage metrics show cumulative count of Article Views (full-text article views including HTML views, PDF and ePub downloads, according to the available data) and Abstracts Views on Vision4Press platform.
Data correspond to usage on the plateform after 2015. The current usage metrics is available 48-96 hours after online publication and is updated daily on week days.
Initial download of the metrics may take a while.