Fig. 2
Download original image
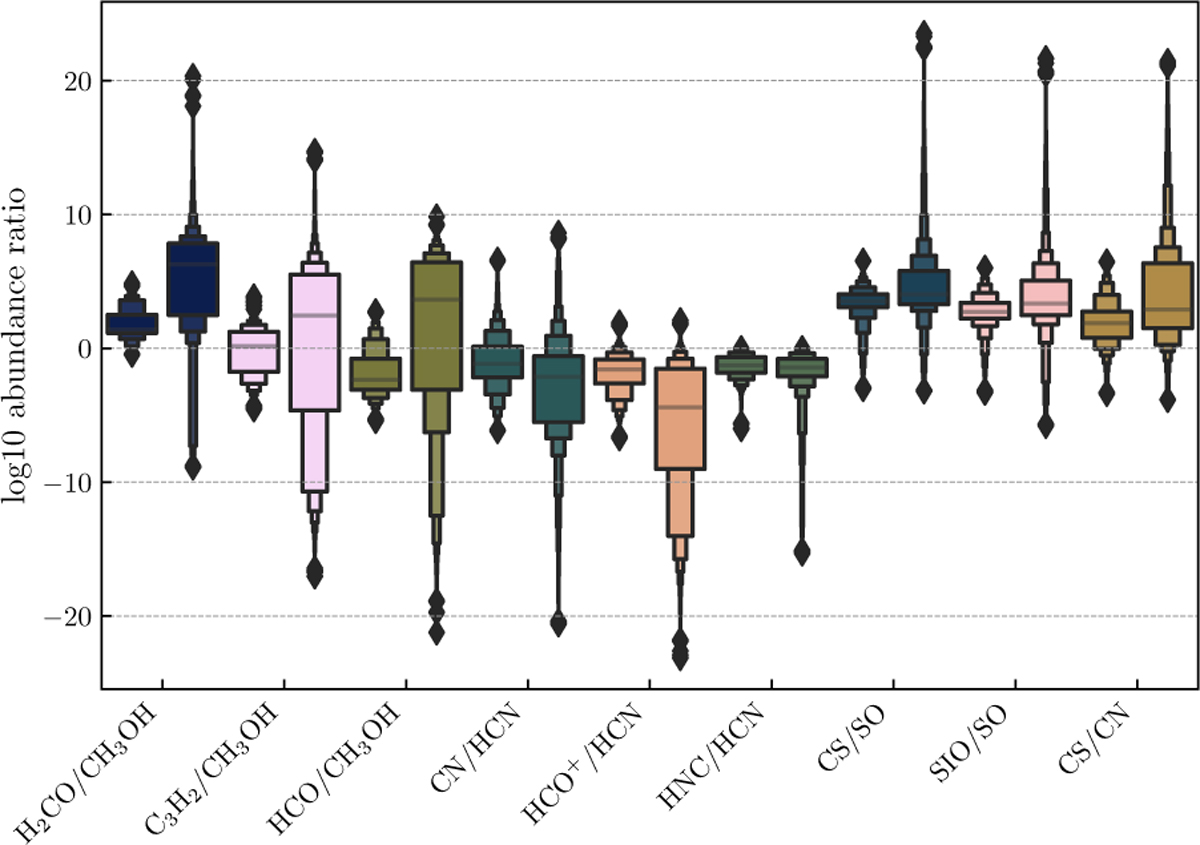
Distribution of each of the ratios that exceeded the detection limit for both molecules. The left distribution for each ratio shows where both molecules are detectable, and the right distribution shows this for each molecule where either molecule is detectable. The line in the central box is the median, the central box contains 50% of the ratios, the next upper and lower boxes together contain 25% and so forth, and the outliers plotted as diamonds.
Current usage metrics show cumulative count of Article Views (full-text article views including HTML views, PDF and ePub downloads, according to the available data) and Abstracts Views on Vision4Press platform.
Data correspond to usage on the plateform after 2015. The current usage metrics is available 48-96 hours after online publication and is updated daily on week days.
Initial download of the metrics may take a while.