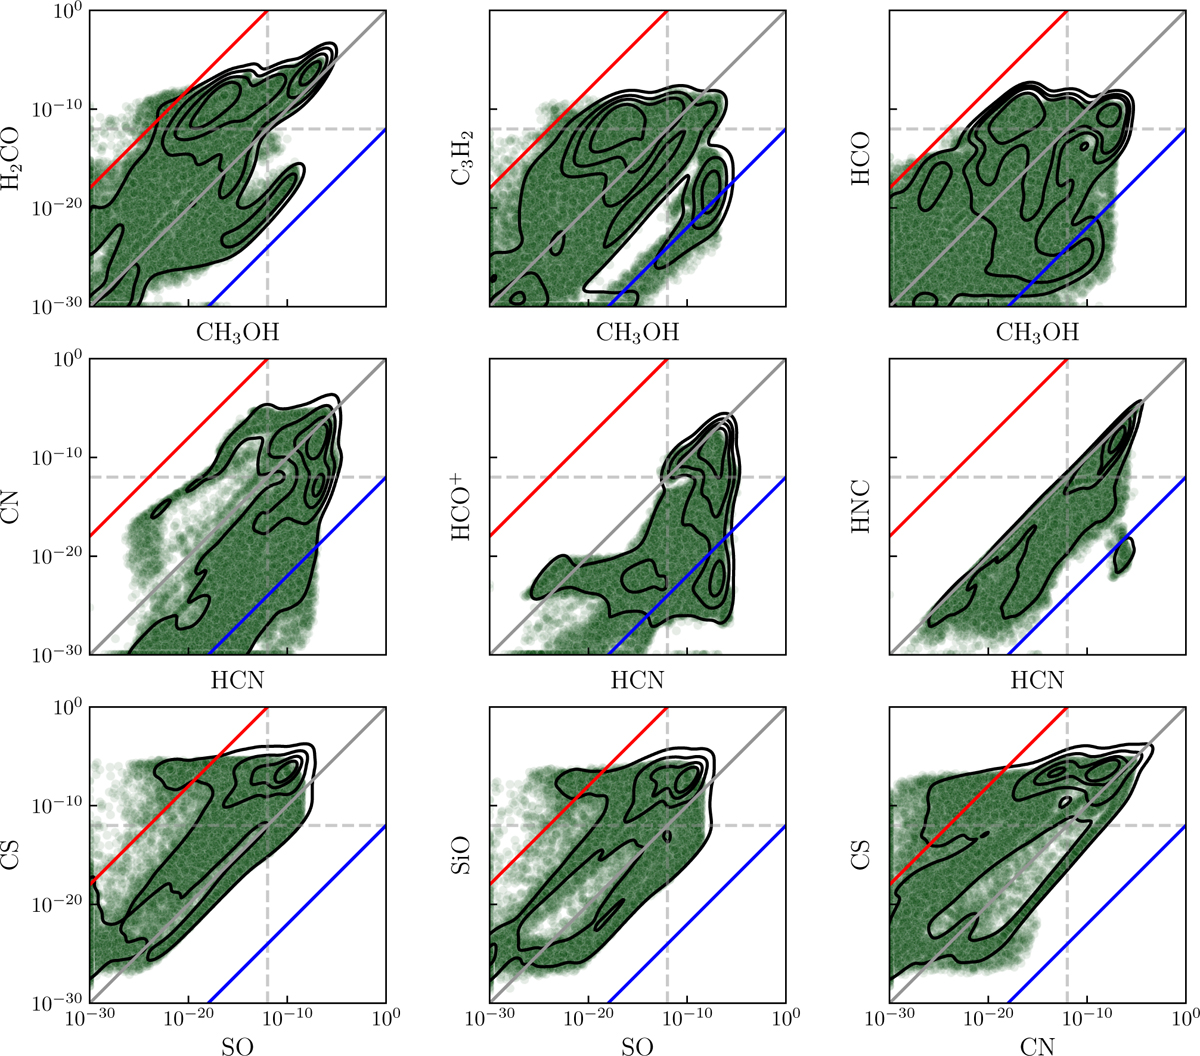
Fig. 1
Download original image
Fractional abundances for each of the ratios. The contour levels of a kernel density estimate are added to highlight the distribution, each representing 20% of the distribution. For both, we show the observational limit of 10−12 that we used throughout. Only the ratios above either observational threshold were used to train the SHAP explainers. The blue line represents all log-ratios of −12, and the red line represents the log-ratios of 12.
Current usage metrics show cumulative count of Article Views (full-text article views including HTML views, PDF and ePub downloads, according to the available data) and Abstracts Views on Vision4Press platform.
Data correspond to usage on the plateform after 2015. The current usage metrics is available 48-96 hours after online publication and is updated daily on week days.
Initial download of the metrics may take a while.