Fig. 8
Download original image
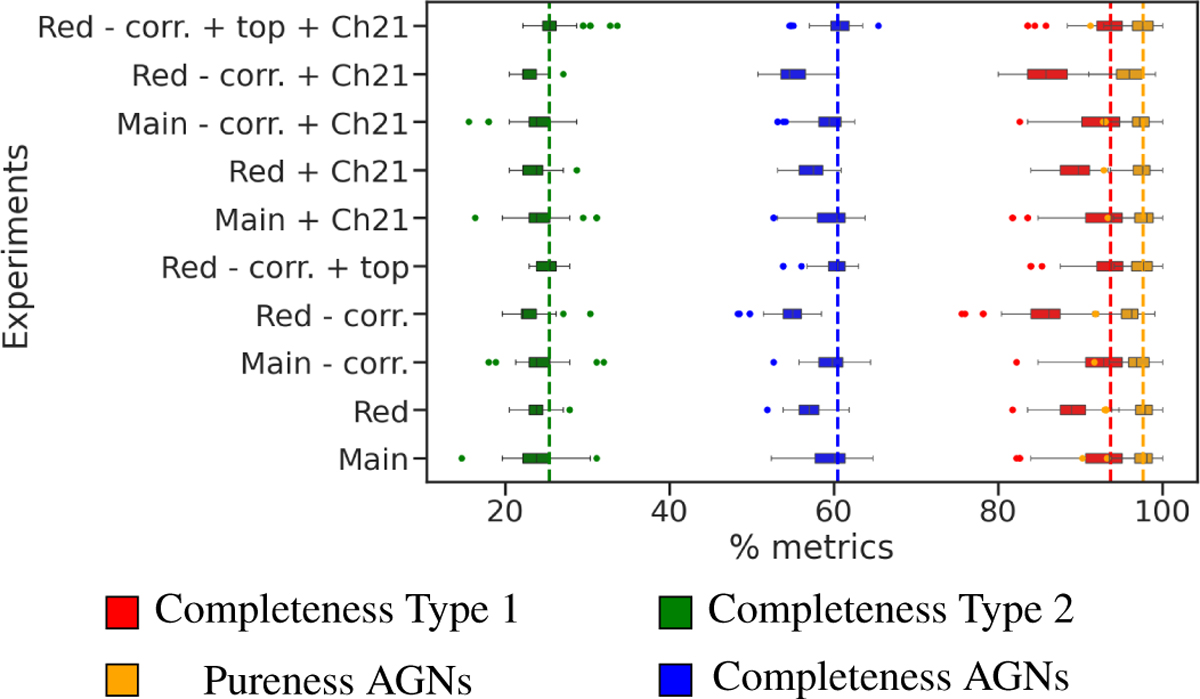
Distribution of the calculated metrics for each experimental configuration. Each colored box represents one of the four metrics: red for Completeness Type 1, green for Completeness Type 2, orange for Pureness AGNs, and blue for Completeness AGNs. Vertical dashed lines correspond to the median values obtained in the best selected experiment (Red - corr. + top Experiment), allowing a direct visual comparison.
Current usage metrics show cumulative count of Article Views (full-text article views including HTML views, PDF and ePub downloads, according to the available data) and Abstracts Views on Vision4Press platform.
Data correspond to usage on the plateform after 2015. The current usage metrics is available 48-96 hours after online publication and is updated daily on week days.
Initial download of the metrics may take a while.