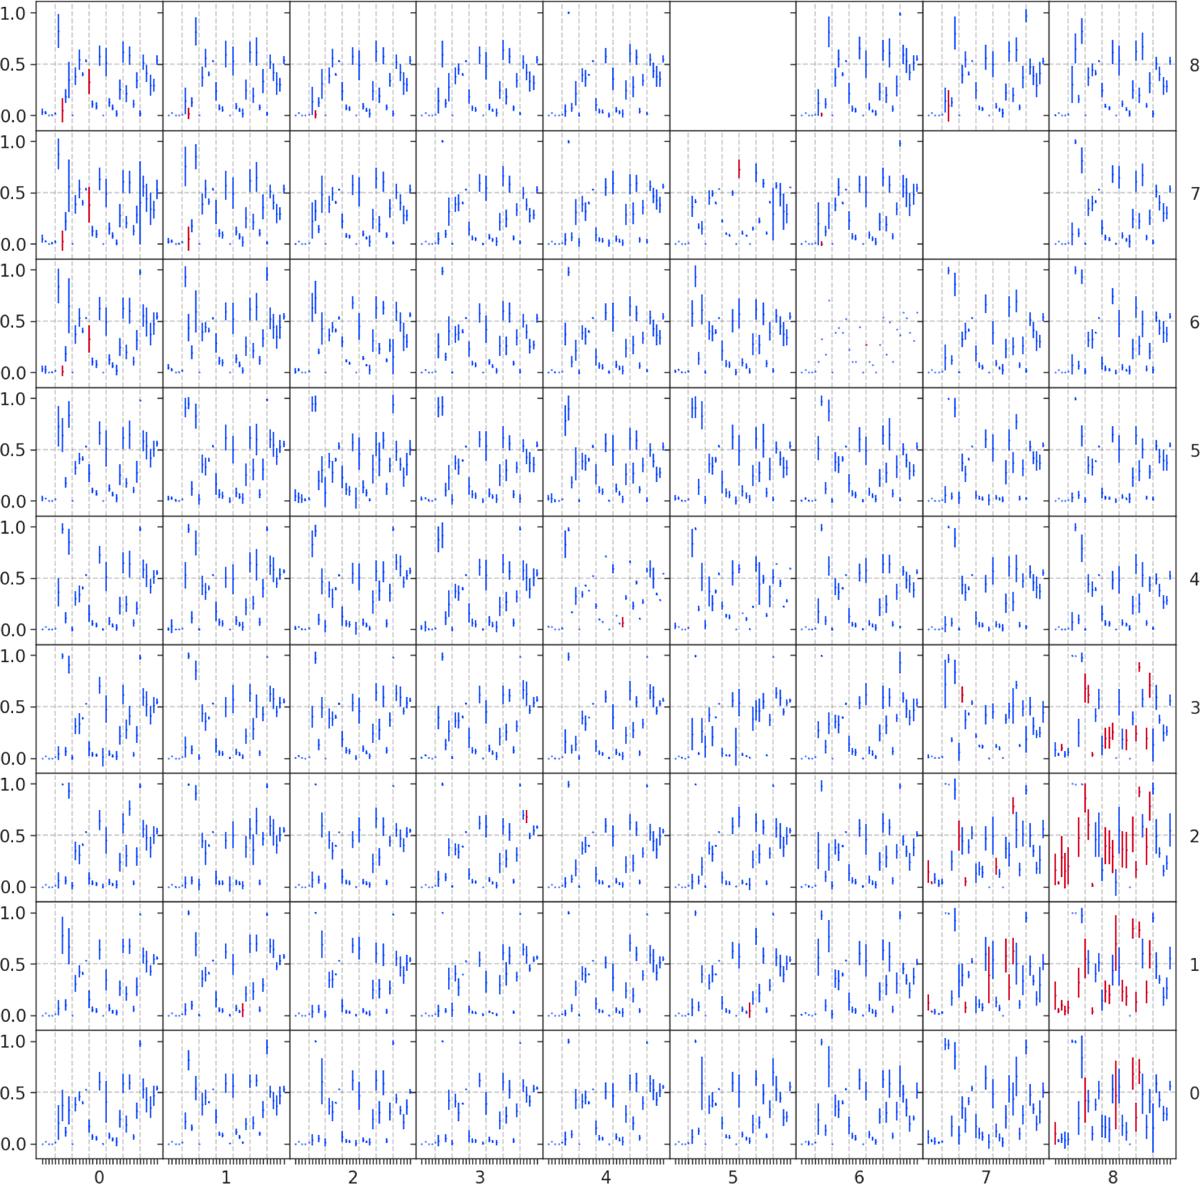
Fig. 6
Download original image
Main Experiment. Distribution of the feature means when considering all the features. In each neuron it is represented the local mean of each features, and the error bars correspond to the local standard deviations. The plotted features are in red when their local mean deviates from the corresponding global mean by twice the global standard deviation. The vertical dashed lines are placed after every five features (e.g., at feature 4,9,14...29) to facilitate reading the plot. Order of the features: 0) ASF, 1) γSF, 2) GP_DRW_τ, 3) GP_DRW_σ, 4) ExcessVar, 5) Pvar, 6) IARφ, 7) Amplitude, 8) AndersonDarling, 9) Autocor_length, 10) Beyond1Std, 11) ηe, 12) Gskew, 13) LinearTrend, 14) MaxSlope, 15) Meanvariance, 16) MedianAbsDev, 17) MedianBRP, 18) PeriodLS, 19) PairSlopeTrend, 20) PercentAmplitude, 21) Q31, 22) Period_fit, 23) ΨCS, 24) Ψη, 25) RCS, 26) Skew, 27) Std, 28) StetsonK, 29) class_star_hst, 30) i-z, 31) r-i, 32) B-r, 33) u-B, 34) z-y.
Current usage metrics show cumulative count of Article Views (full-text article views including HTML views, PDF and ePub downloads, according to the available data) and Abstracts Views on Vision4Press platform.
Data correspond to usage on the plateform after 2015. The current usage metrics is available 48-96 hours after online publication and is updated daily on week days.
Initial download of the metrics may take a while.