Fig. 4
Download original image
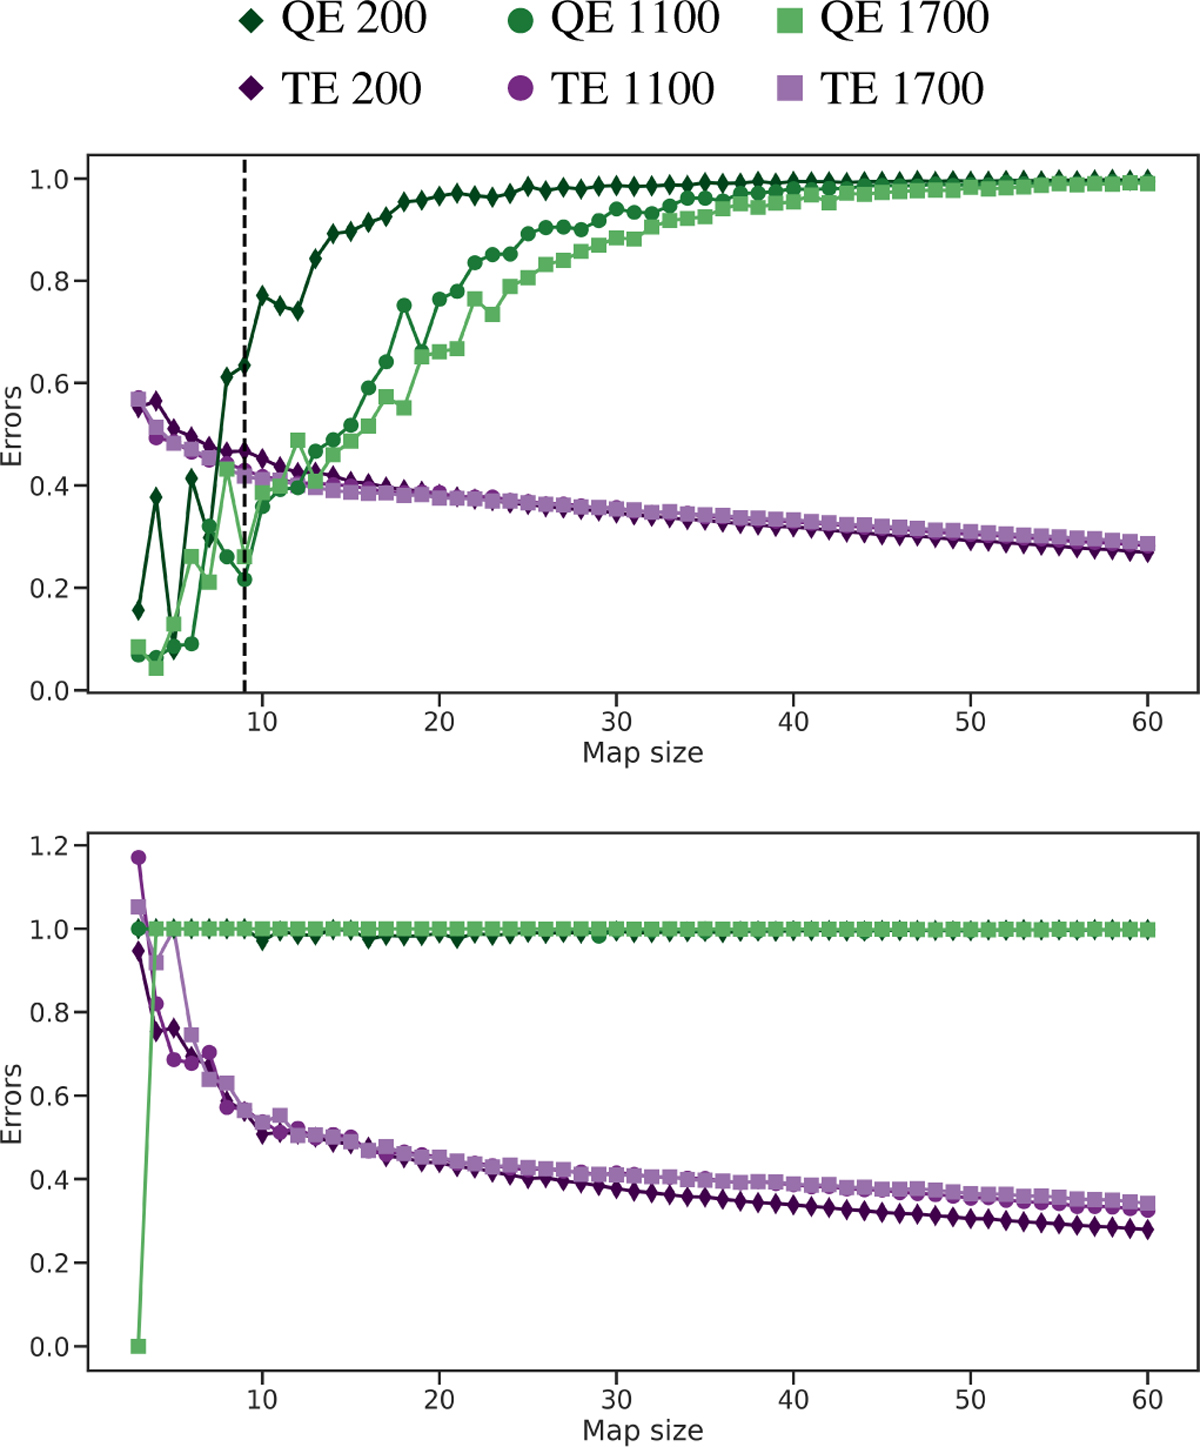
Distribution of the quantization error (QE, represented in different shades of green) and topographic error (TE, represented in different shades of purple) as a function of the map size of the SOM, assuming as neighborhood function a Gaussian (top panel) and a Mexican hat (bottom panel). In each plot, the number of training epochs is set to 200 (diamond markers), 1100 (circles) and 1700 (squares), respectively. The dotted line represents the optimal SOM size for representing our dataset with 1100 training epochs.
Current usage metrics show cumulative count of Article Views (full-text article views including HTML views, PDF and ePub downloads, according to the available data) and Abstracts Views on Vision4Press platform.
Data correspond to usage on the plateform after 2015. The current usage metrics is available 48-96 hours after online publication and is updated daily on week days.
Initial download of the metrics may take a while.