Fig. 13
Download original image
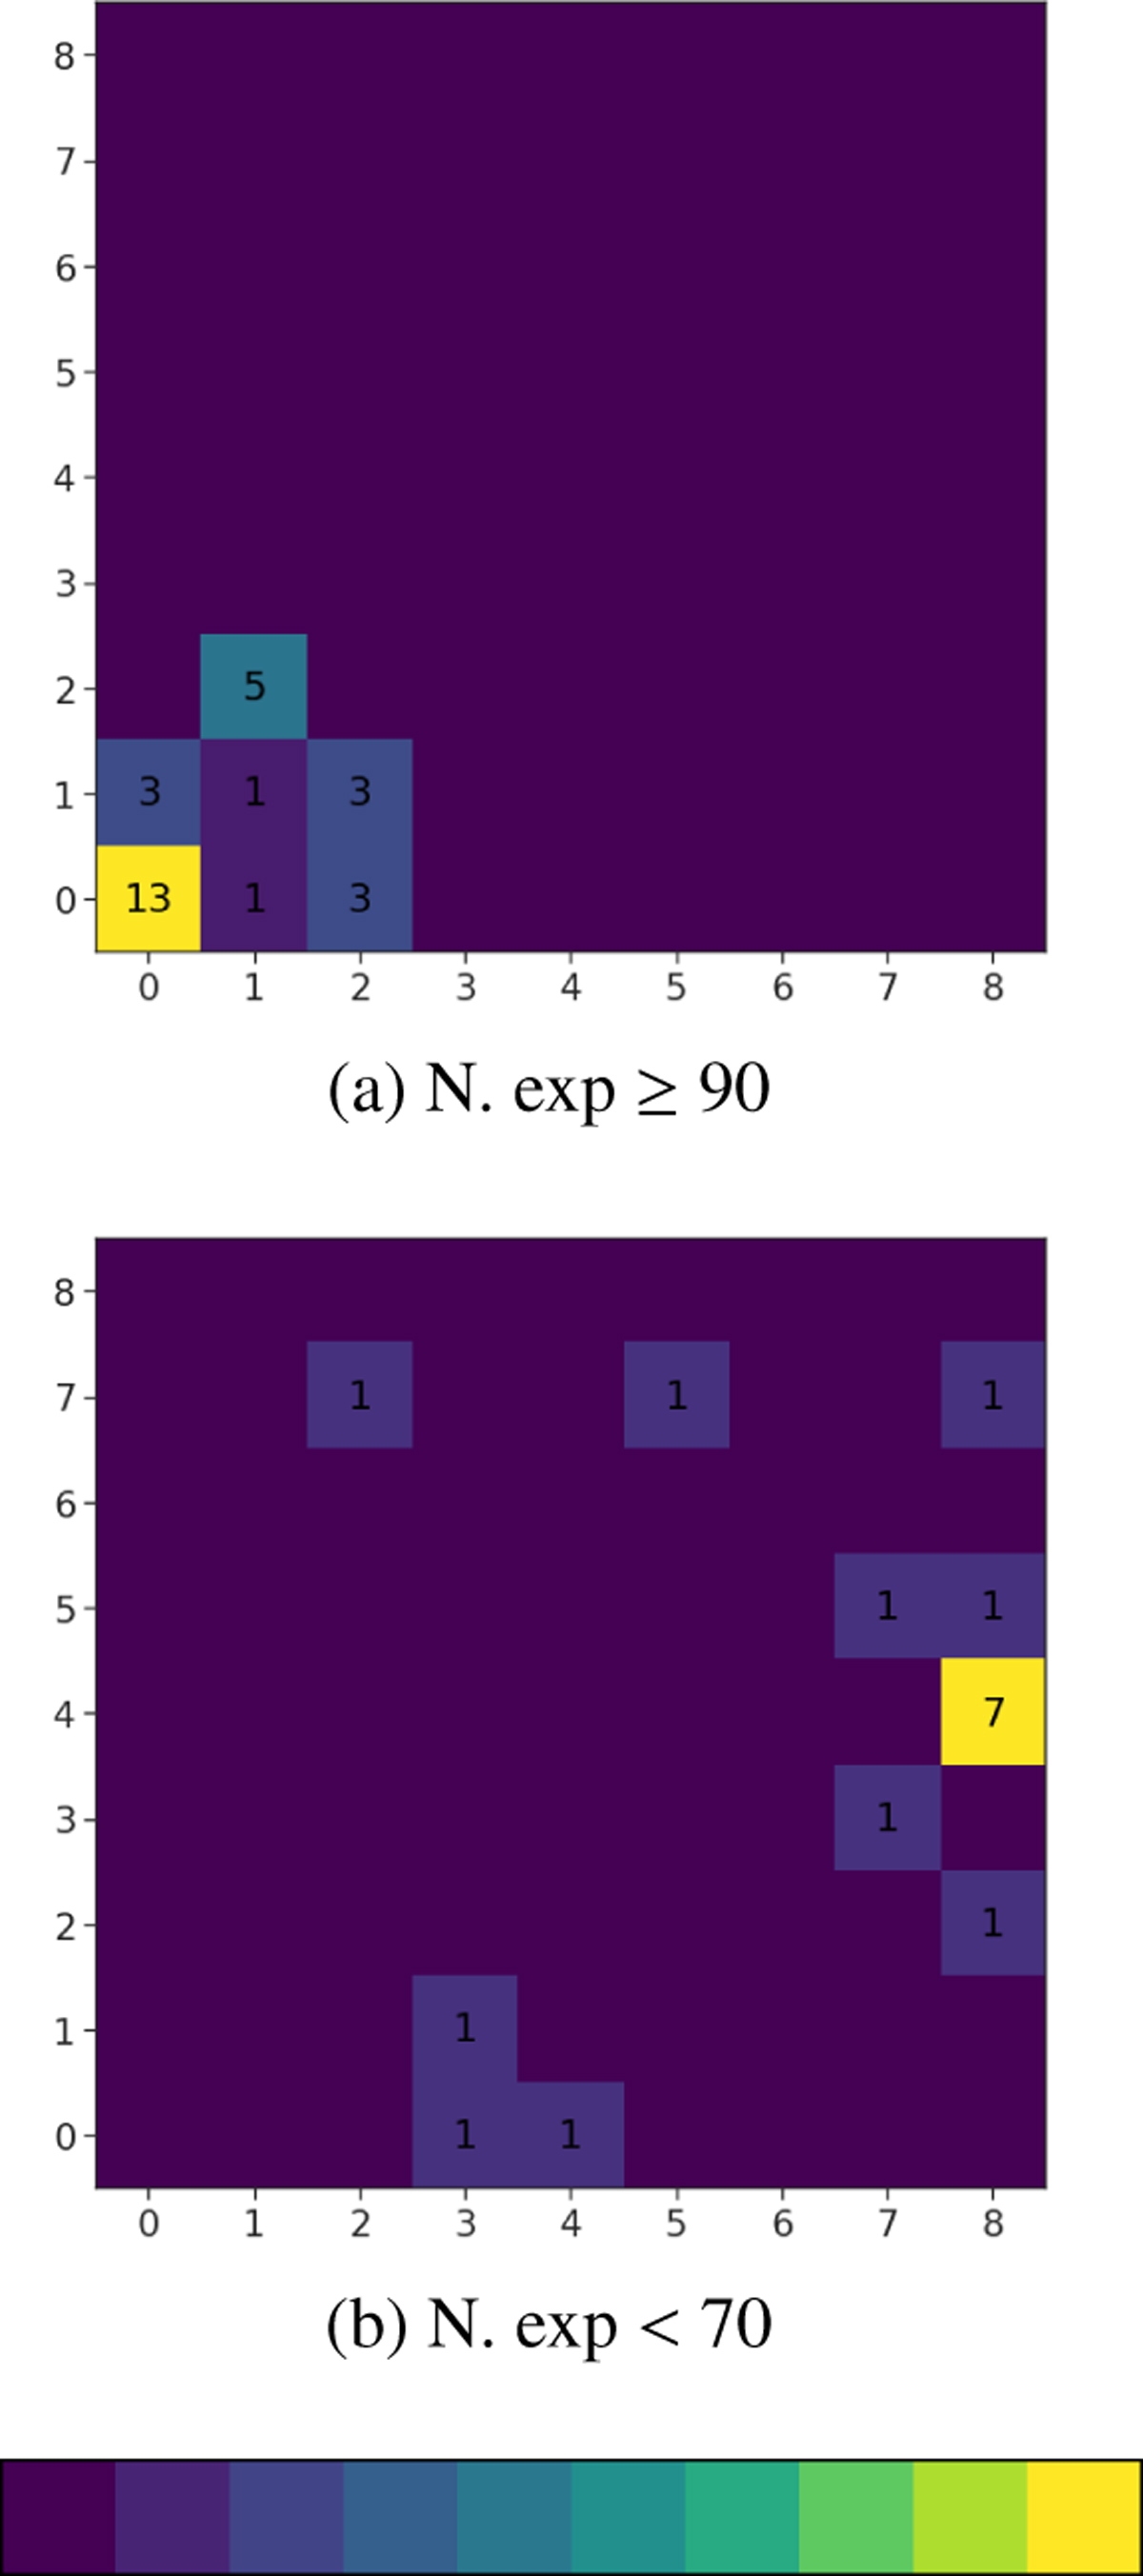
Distribution of the most recurrent Type 2 AGNs within the AGNs-majority cells of the map obtained with seed = 188. The color scale indicates the number of such objects associated with each neuron. Top panel: Type 2 that populate AGNs-majority cells in more than 90 out of 100 experiments. Bottom panel: Type 2 that populate AGNs-majority cells in fewer than 70 experiments.
Current usage metrics show cumulative count of Article Views (full-text article views including HTML views, PDF and ePub downloads, according to the available data) and Abstracts Views on Vision4Press platform.
Data correspond to usage on the plateform after 2015. The current usage metrics is available 48-96 hours after online publication and is updated daily on week days.
Initial download of the metrics may take a while.