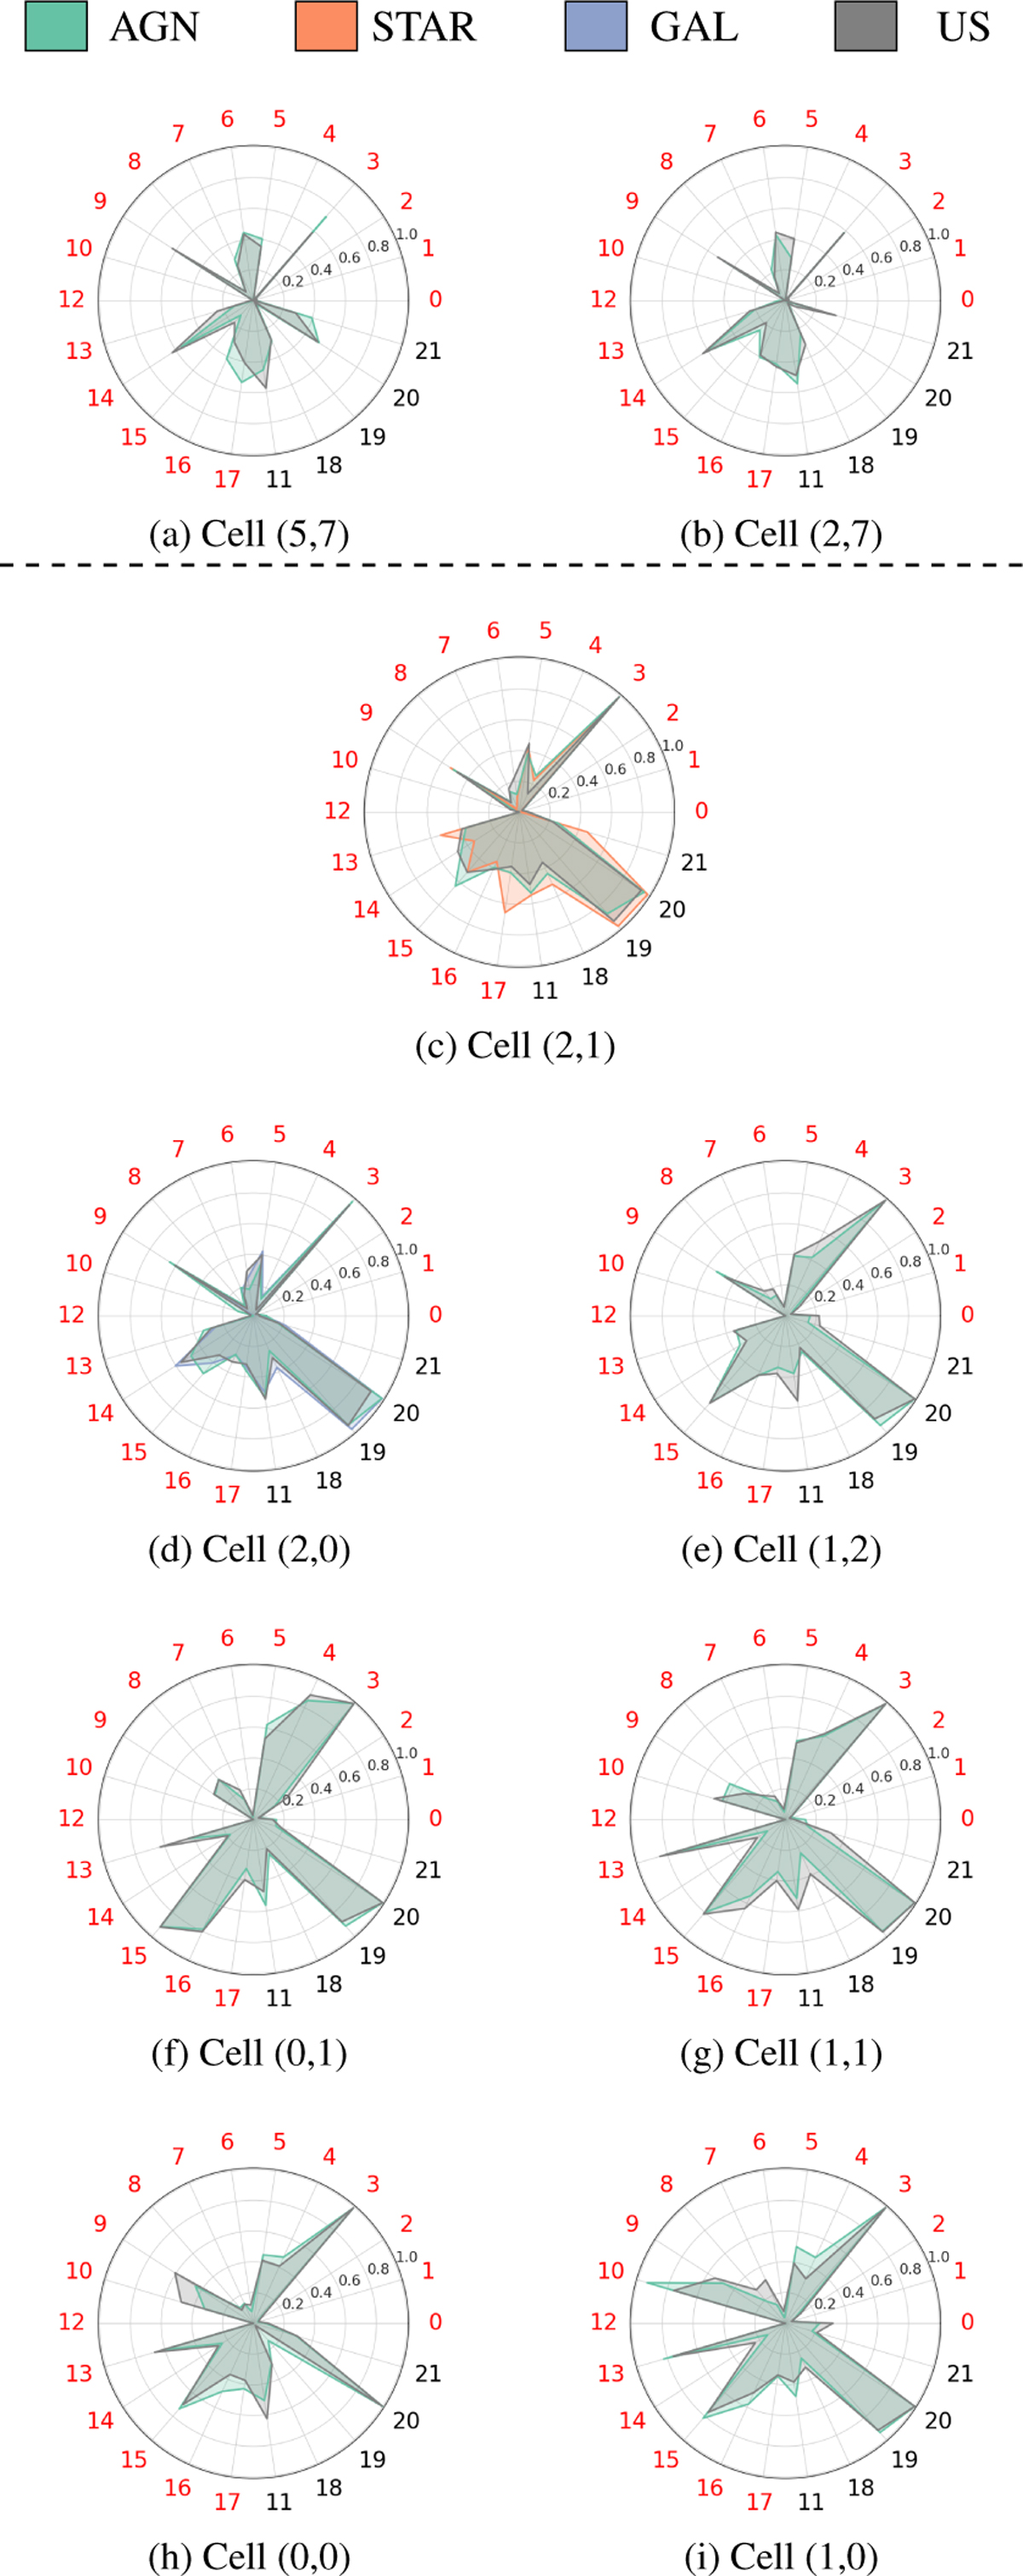
Fig. 11
Download original image
Distribution of the mean values per neuron of both red and never red features. Results are reported for neurons with an AGNs majority. The top cells (2,7) and (5,7) are separated by the dotted line as they each contain only one labeled AGN. The reader should note that the feature order is chosen to separate red from never-red features. Indexes of features: 0) ASF, (1) γSF, (2) ExcessVar, (3) IARφ, (4) Autocor_length, (5) Beyond1Std, (6) ηe, (7) MaxSlope, (8) Medi-anAbsDev, (9) MedianBRP, (10) PeriodLS, (11) PairSlopeTrend, (12) Period_fit, (13) ΨCS, (14) Ψη, (15) Rcs, (16) StetsonK, (17) r-i, (18) u-B, (19) class_star_hst, (20) Pvar, (21) B-r.
Current usage metrics show cumulative count of Article Views (full-text article views including HTML views, PDF and ePub downloads, according to the available data) and Abstracts Views on Vision4Press platform.
Data correspond to usage on the plateform after 2015. The current usage metrics is available 48-96 hours after online publication and is updated daily on week days.
Initial download of the metrics may take a while.