Open Access
Fig. 21.
Download original image
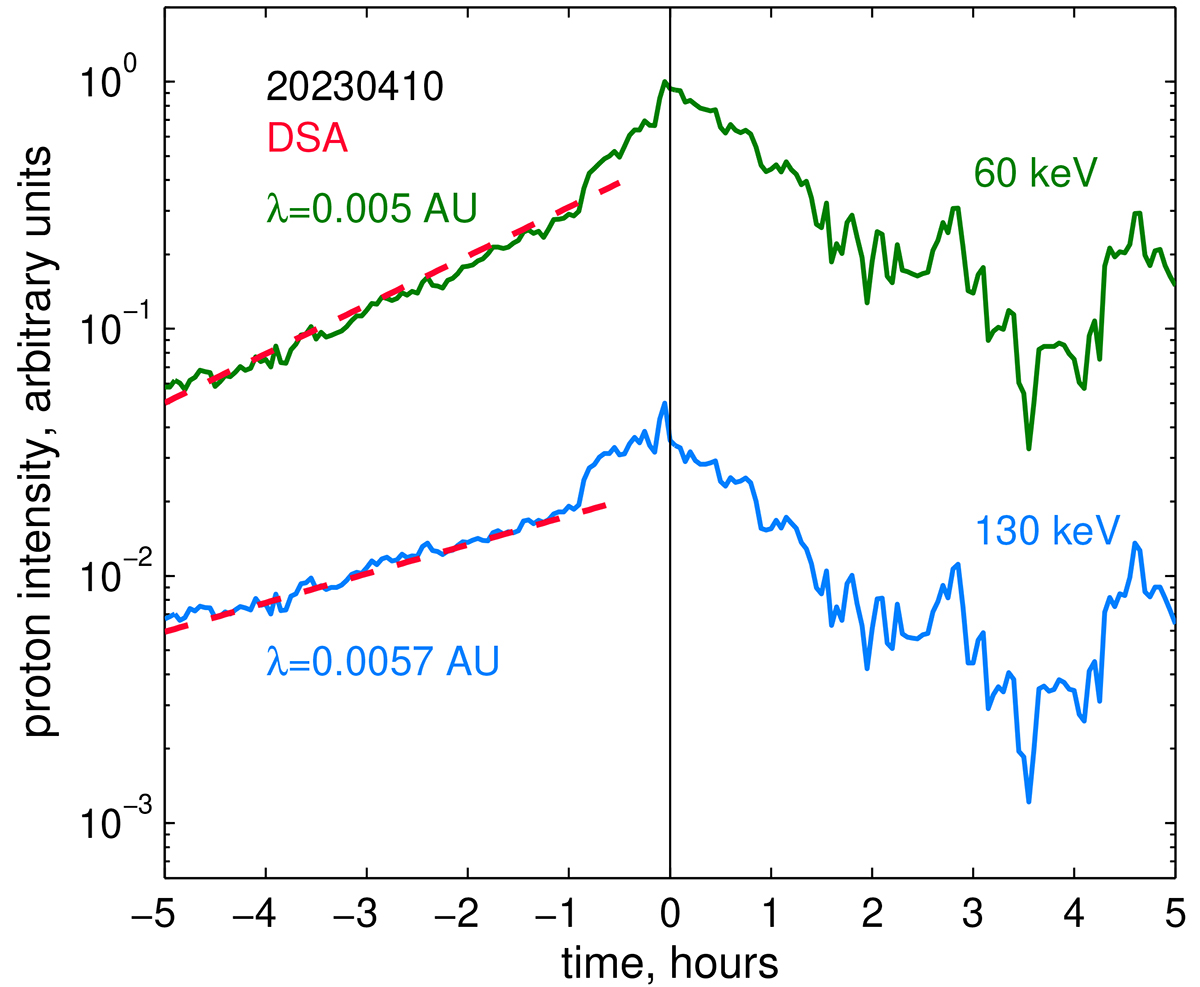
DSA fitting analysis for the IP shock on 10 April 2023. The proton intensities are shown in arbitrary units for the energies of 60 keV and 130 keV, as shown in the legend. The DSA fitting in the upstream region of the shock is indicated by the red dashed curve. Details are given in the main text.
Current usage metrics show cumulative count of Article Views (full-text article views including HTML views, PDF and ePub downloads, according to the available data) and Abstracts Views on Vision4Press platform.
Data correspond to usage on the plateform after 2015. The current usage metrics is available 48-96 hours after online publication and is updated daily on week days.
Initial download of the metrics may take a while.