Open Access
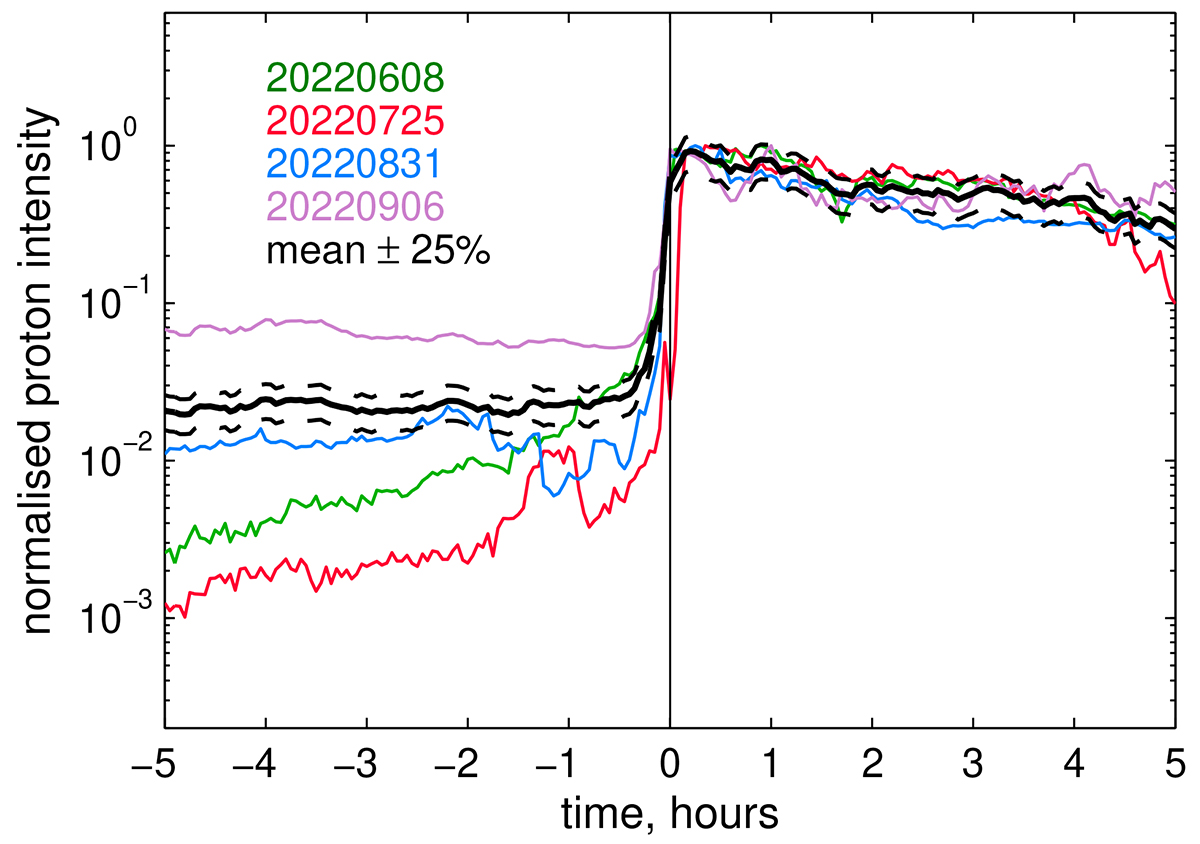
Fig. 20.
Download original image
Superposed epoch analysis for the plateau proton response. The normalisation was done at each event for the maximum observed proton intensity value. Legend as in Fig. 19.
Current usage metrics show cumulative count of Article Views (full-text article views including HTML views, PDF and ePub downloads, according to the available data) and Abstracts Views on Vision4Press platform.
Data correspond to usage on the plateform after 2015. The current usage metrics is available 48-96 hours after online publication and is updated daily on week days.
Initial download of the metrics may take a while.