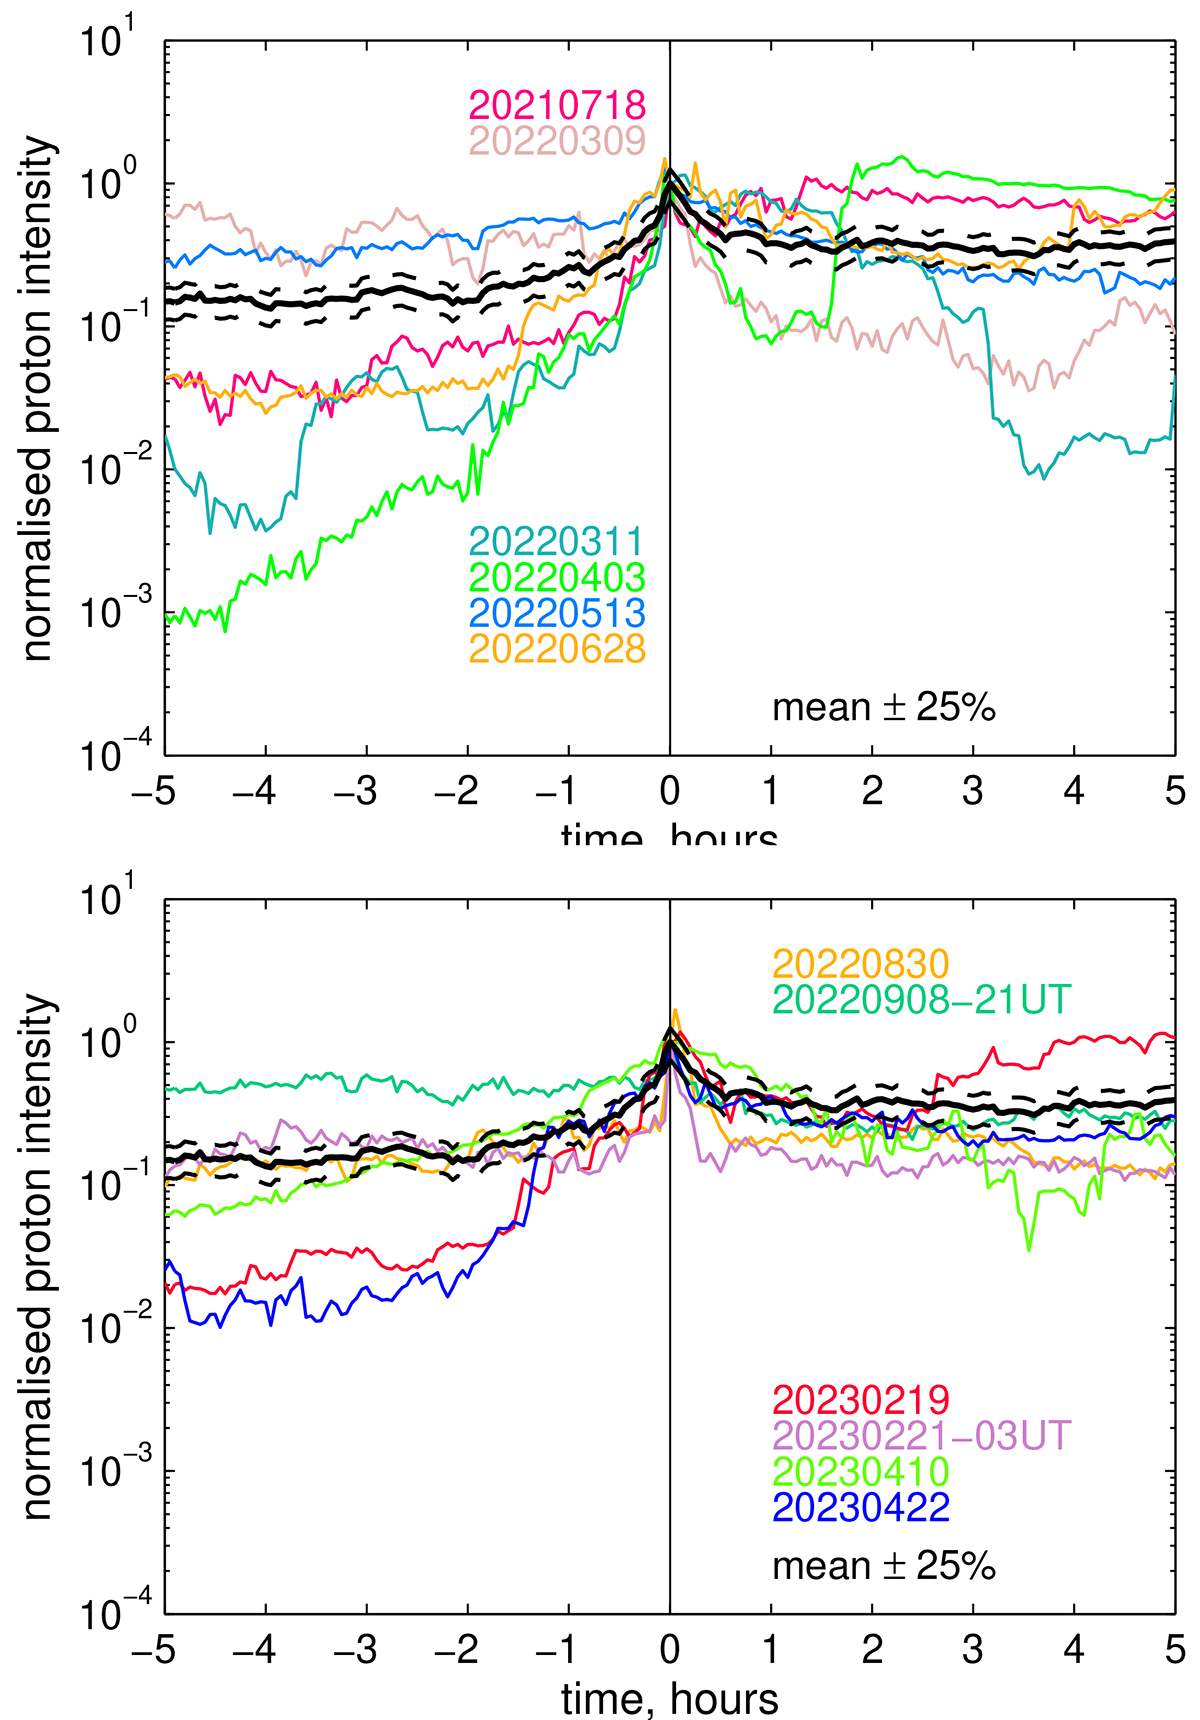
Fig. 19.
Download original image
Superposed epoch analysis for the regular peak proton response. The differently coloured curves show the normalised 60 keV proton intensity for the 12 regular types of events, as indicated in the legend. The black solid and black dashed curves represent the mean and ±25% values, respectively. The normalisation was done at each event for the observed proton intensity value at the IP shock front. We divided the figure into two panels for better visualisation.
Current usage metrics show cumulative count of Article Views (full-text article views including HTML views, PDF and ePub downloads, according to the available data) and Abstracts Views on Vision4Press platform.
Data correspond to usage on the plateform after 2015. The current usage metrics is available 48-96 hours after online publication and is updated daily on week days.
Initial download of the metrics may take a while.