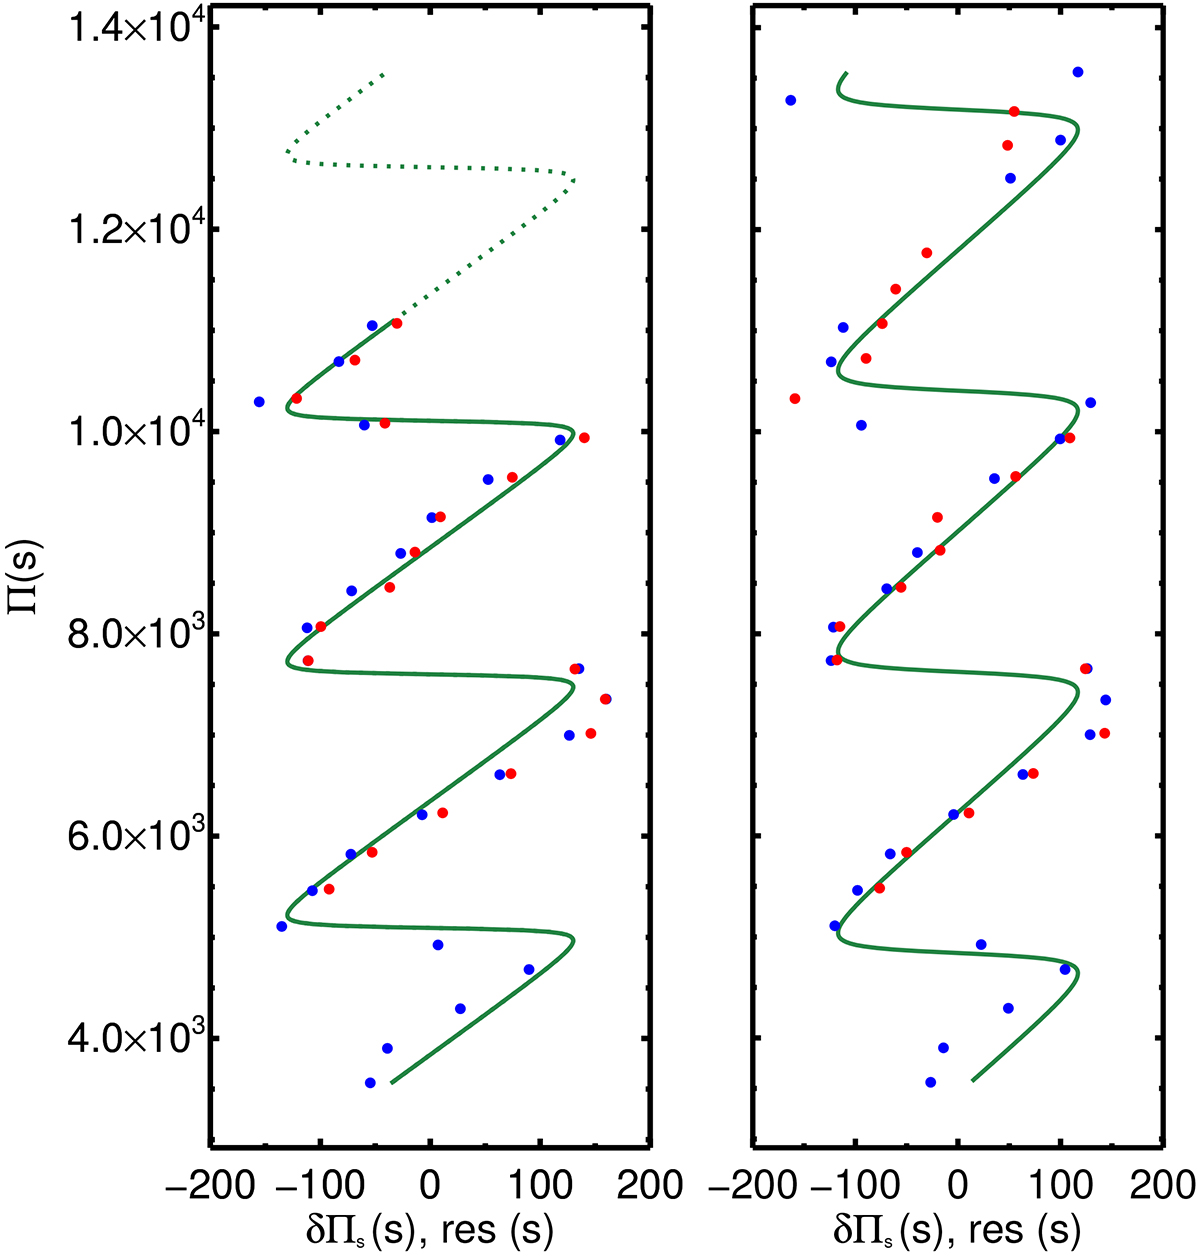
Fig. 3.

Download original image
KIC 10553698A echelle diagrams displaying the data for l = 1 (blue) and l = 2 (red) modes, along with the best fit model for the case of a one step-like glitch (green). The continuous analytical solution is represented by the full line in the reduced periods’ range in which the fit was performed and by a dotted line in the range not considered in the fit. Left panel: Fit to l = 1 and l = 2 modes’ reduced periods smaller than 11 100 s (case C). The data used in this fit were also used to construct the reduced period spacings for case B in Table 1, whose fit is shown in the bottom panel of Fig. 2. Right panel: Fit to l = 1 and l = 2 modes’ reduced periods in the full range (up to n = 34) extracted from Table A.2 (case E). When several modes are listed for a given radial order and degree (or for the same trapped mode), one single mode was picked randomly (see text for details).
Current usage metrics show cumulative count of Article Views (full-text article views including HTML views, PDF and ePub downloads, according to the available data) and Abstracts Views on Vision4Press platform.
Data correspond to usage on the plateform after 2015. The current usage metrics is available 48-96 hours after online publication and is updated daily on week days.
Initial download of the metrics may take a while.


