Fig. 2.
Download original image
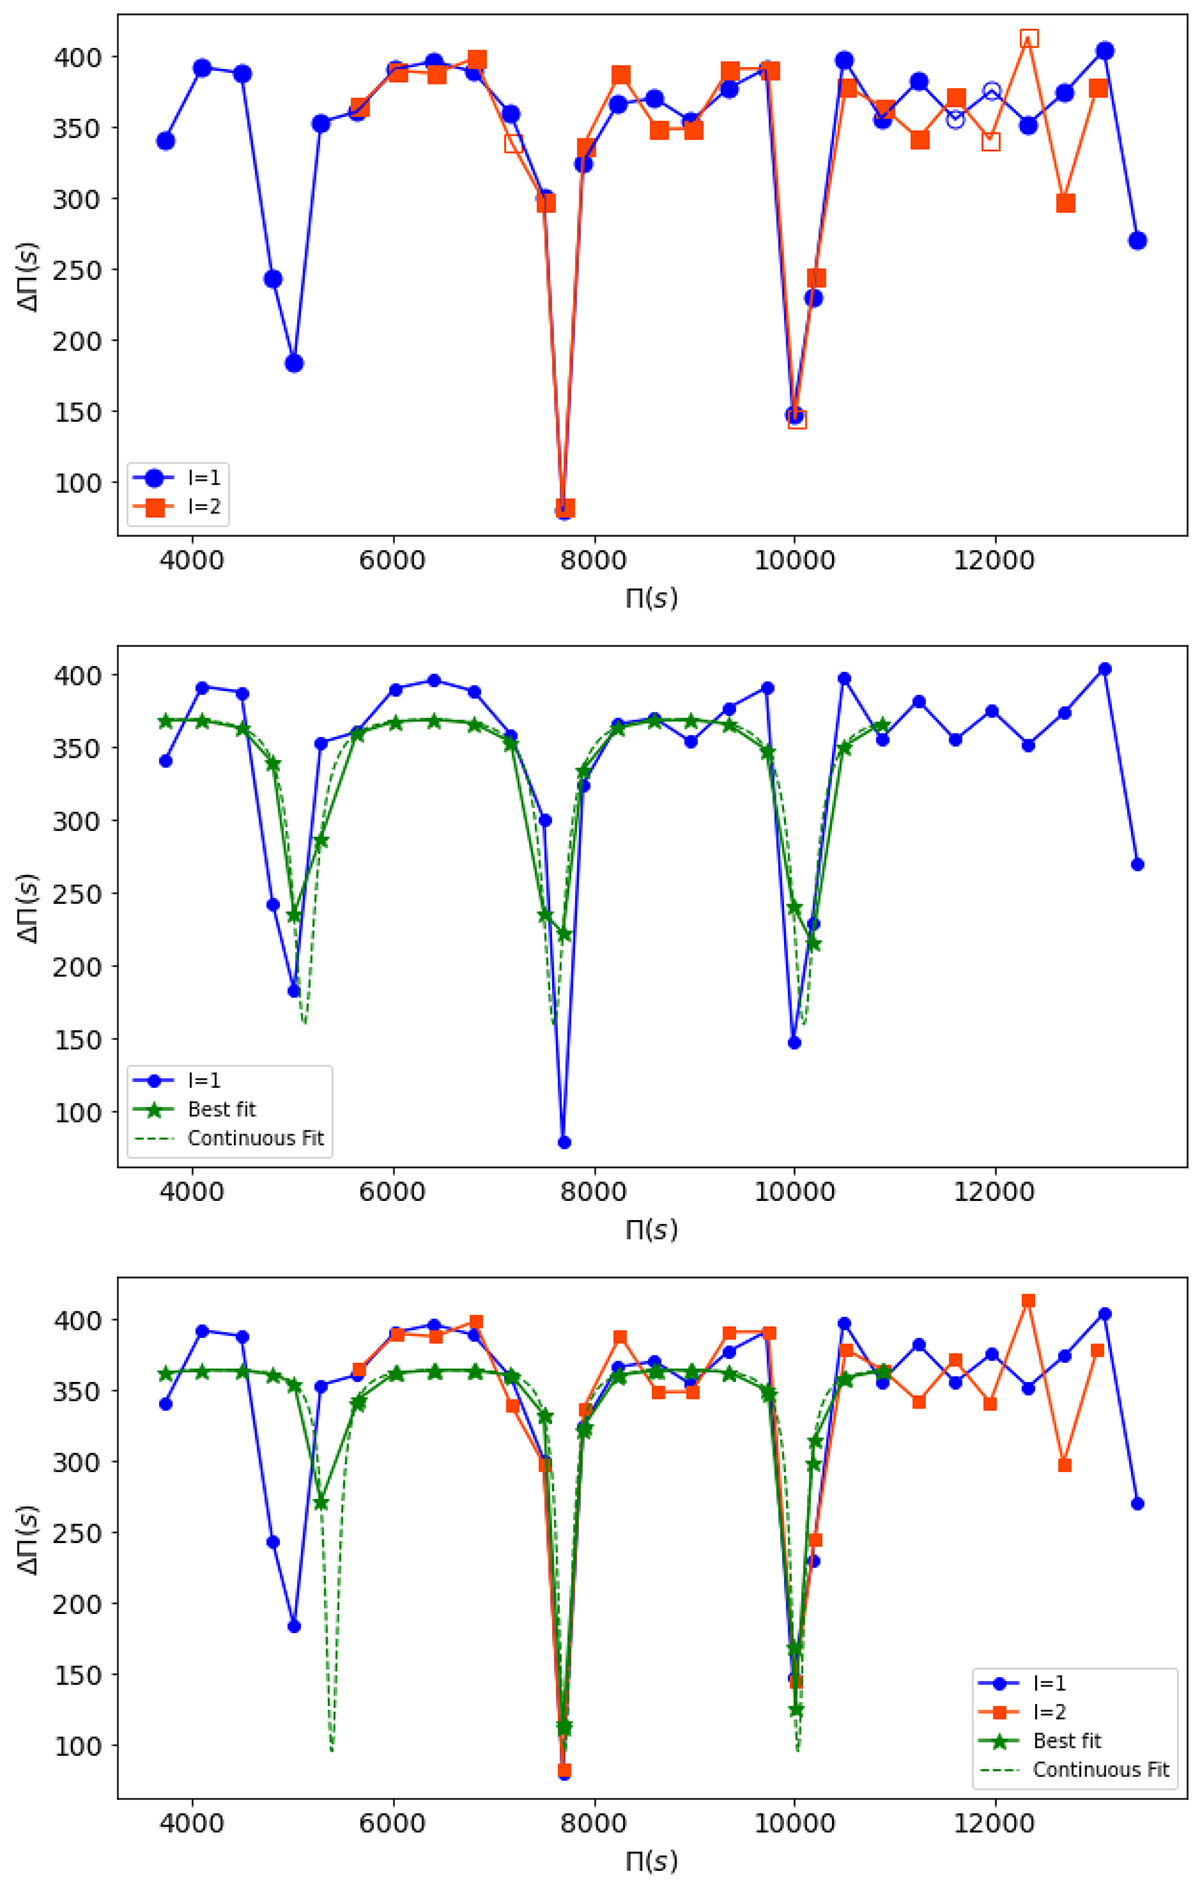
KIC 10553698A reduced period spacings as a function of the reduced period. Each reduced period spacing is plotted at the mid point between the reduced periods used in its computation. The parameters for the best fit solutions are given in Appendix C. Top panel: observed reduced period spacings for l = 1 (blue) and l = 2 (red) in the full range. The discrete observed values are joined by straight lines to guide the eye. Open symbols indicate reduced period spacings that cannot be computed from the frequencies listed in the original table (see section 3.8 of Østensen et al. 2014, for details). Middle panel: the best fit solution to the l = 1 reduced period spacings at reduced periods smaller than 11 100 s, for the case of a one step-like glitch (green) (case A). The continuous analytical solution is represented by the dashed line, while the filled stars indicate the values of the solution at the reduced periods corresponding to the locations of the observations. Bottom panel: similar to middle panel, but including in the fit both the l = 1 (blue) and the l = 2 (red) modes at reduced periods smaller than 11 100 s (case B).
Current usage metrics show cumulative count of Article Views (full-text article views including HTML views, PDF and ePub downloads, according to the available data) and Abstracts Views on Vision4Press platform.
Data correspond to usage on the plateform after 2015. The current usage metrics is available 48-96 hours after online publication and is updated daily on week days.
Initial download of the metrics may take a while.