| Issue |
A&A
Volume 699, July 2025
|
|
|---|---|---|
| Article Number | A116 | |
| Number of page(s) | 15 | |
| Section | Planets, planetary systems, and small bodies | |
| DOI | https://doi.org/10.1051/0004-6361/202553661 | |
| Published online | 10 July 2025 | |
Estimation of the particle-size distributions of regolith on the surface of (25143) Itokawa based on near-infrared reflectance spectra
School of Earth Sciences, China University of Geosciences,
Wuhan,
China
★ Corresponding author: This email address is being protected from spambots. You need JavaScript enabled to view it.
Received:
2
January
2025
Accepted:
20
May
2025
Abstract
Aims. We used near-infrared reflectance spectra to infer the particle-size distributions of regolith on asteroid Itokawa to provide a potential alternative to the traditional thermal infrared method.
Methods. We calculated the model reflectance spectra of LL5 and LL6 chondrite particles with varying sizes and took space weathering effects into account. The model spectra were then compared with the Itokawa near-infrared spectra to estimate the particlesize distributions of its regolith. In addition, we performed a spectral feature analysis and retrieved the mineral content to validate the results of the size retrieval.
Results. The average regolith size we retrieved based on all near-infrared spectrometer data is 25-310 μm, and the results reveal a clear dichotomy: The particle sizes in flat and rough terrains are approximately 10-100 μm and 50-500 μm, respectively. The spectral features agree with the topography features of Itokawa, and the olivine contents of different regions are quite uniform. These results reveal that the spectral variations in different regions of Itokawa are mainly caused by variations in the grain size of the regolith and not by its mineral compositions.
Conclusions. Near-infrared reflectance spectroscopy may be a promising tool for estimating the particle-size distributions of regolith on planetary bodies such as asteroid Itokawa.
Key words: minor planets, asteroids: general / planets and satellites: surfaces / minor planets, asteroids: individual: (25143) Itokawa
© The Authors 2025
 Open Access article, published by EDP Sciences, under the terms of the Creative Commons Attribution License (https://creativecommons.org/licenses/by/4.0), which permits unrestricted use, distribution, and reproduction in any medium, provided the original work is properly cited.
This article is published in open access under the Subscribe to Open model. This email address is being protected from spambots. You need JavaScript enabled to view it. to support open access publication.
1 Introduction
Planetary regolith on airless bodies is the product of prolonged space weathering processes (e.g., Hapke 2001; Pieters & Noble 2016), and its characteristics contains rich information about the evolution history and space environment of the planets. The particle-size distribution on a planetary surface determines the diurnal temperature variations of the surface, and it is also a crucial factor for selecting a landing or sampling site (Burke et al. 2021). Traditionally, the remote-sensing determination of the particle size on airless bodies mainly relied on thermal infrared (TIR) measurements because the thermal inertias of regolith with different grain sizes can be effectively differentiated by temperature variations (e.g., Emery et al. 2014; Sugita et al. 2019). However, TIR measurements are limited by the terrestrial atmospheric window, by the higher cost of cryogenic detectors, by complex calibration procedures, and by limited signal-to-noise ratios. Compared to TIR measurements, measurements of the visible and near-infrared (VNIR) reflectance have several advantages. First, much of the solar radiation is concentrated in the spectral region from 0.2 to 2.5 μm, which means that VNIR measurements are more effective in their signal-to-noise ratio. Second, the calibration procedure for VNIR reflectance measurements is simpler than that of TIR measurements, which require a blackbody and cryogenic detector. Third, the terrestrial atmospheric window is more transparent in the VNIR than in the TIR, which means that ground-based measurements are more feasible in the VNIR.
Although the particle size has long been recognized to influence VNIR reflectance spectra (e.g., Pieters et al. 1993), studies of the mineral and chemical composition have dominated planetary spectral data analysis. Only a few studies have attempted to use VNIR reflectance spectra to estimate the regolith grain size on small bodies (e.g., Hiroi et al. 1994). As recent space missions have returned more disk-resolved planetary spectral data, interest has grown in examining the particle-size effects in VNIR spectra. Recent studies of VNIR reflectance spectra for igneous rocks and ordinary and carbonaceous chondrites with differing grain sizes (Zhuang et al. 2023; Bowen et al. 2023; Cantillo et al. 2023) have revealed that VNIR spectral features, such as albedo, spectral slope, and absorption depth, are clearly dependent on the material composition and particle size. For example, our measurements on igneous rocks show that spectral parameters including the albedo, the absorption band depth, the band area, and the band width have different particle-size dependences for materials with high and low albedos (Zhuang et al. 2023). As a result, VNIR spectroscopy might be useful in retrieving the particle-size distributions on airless bodies.
To explore whether VNIR reflectance spectra can be used to estimate the planetary regolith size distributions, we selected asteroid Itokawa as our study object because this asteroid is known for significant variations in the topography and the rock sizes across its surface. In addition, the small volume of Itokawa means that it has probably not experienced significant differentiation or geological evolution since its formation. Numerous spectral studies also supported the assumption that its surface material is compositionally uniform (Abe et al. 2006;
Hiroi et al. 2006), and the effect of mineralogical variations on the particle-size estimates derived from spectral data is therefore very weak (Poulet et al. 2007; Ody et al. 2013). Itokawa can be divided into three distinct regions: the head, the body, and the neck. Most areas of the head and body consist of rough terrain with large rocks, while the neck hosts the two largest flat terrain regions, MUSES-C and Sagamihara Regio (Fujiwara et al. 2006). Before the Hayabusa mission, only a limited number of disk-integrated thermal infrared data of Itokawa obtained through ground-based observations were available (Müller et al. 2005), and it was difficult to use these data to study the regolith size distribution on Itokawa. The Hayabusa mission performed extensive reflectance spectra measurements of Itokawa at close distances, and it thus provided us with a large number of disk-resolved near-IR (NIR) data for analysis. Furthermore, the returned Itokawa samples (e.g., Nakamura et al. 2011; Tsuchiyama et al. 2014) enable us to validate the results of the regolith size retrieval. We first generated the model reflectance spectra of the regolith based on laboratory reflectance spectra of ordinary chondrite that is thought to be the analog of Itokawa. By comparing the model spectra and remote-sensing spectra of Itokawa, we estimated the global particle-size distribution. We also examined the relation between the spectral features and the surface unit morphology to validate the results of the grain size inversion based on our recent findings that the spectral features and grain size are connected. Finally, to exclude any compositional effects on the size retrieval results, we evaluated the mineral abundance distribution on the surface of Itokawa to confirm its compositional uniformity.
2 Data
2.1 NIRS data
We used the Hayabusa near-infrared spectrometer (NIRS) reflectance spectra in radiance factor (I/F) from the NASA Planetary Data System (Abe et al. 2011). The NIRS consists of an infrared grating spectrometer with a 64-channel InGaAs photodiode array detector and has a spectral resolution of about 23.6 nm per channel and a field of view of 0.1° × 0.1°. The NIRS wavelength range spans 0.76-2.25 μm with a usable range of 0.85-2.1 μm because the detector sensitivity deteriorates at both ends of the spectral range. The NIRS data include more than 80 000 spectra collected from September to November 2005. These data were categorized into four groups based on the mission phases: the approach phase (AP) that spanned from 50 km to 20 km from Itokawa; the gate position phase (GP) that lasted from between 20 km and 8 km; the home position phase (HP) at approximately 7 km; and the descent and touchdown phase (TD) that focused on the descent that was made to sample surface materials. The spatial resolution of the data during the AP phase was low and the detector position and pointing during the TD phase was uncertain (Kitazato et al. 2008). We therefore primarily used the GP and HP spectra. Additionally, to enhance the reliability of our statistical analysis, we discarded spectra with an average deviation value higher than 0.03 at all bands. The photometric model we used to derive the particle-size distributions is based on the radiative transfer equation, which diverges at very large zenith angles, and we therefore also excluded reflectance spectra that were measured at incident solar zenith angles larger than 80°. The final dataset contained 50798 spectra, and the center positions of the spectra are shown in Fig. 1.
The NIRS data described above underwent a series of calibrations, including radiometric and spectral calibrations (Abe et al. 2011), which yielded bidirectional reflectance data in radiance factor. Because the bidirectional reflectance depends on the illumination and the viewing geometries (e.g., Beck et al. 2012; Hapke 2002; Ni et al. 2024), the NIRS data span a range of observational configurations, including the incident zenith angle, the viewing zenith angle, and the solar phase angle. We also performed photometric corrections using the Hapke photometric parameters of Itokawa derived by Kitazato et al. (2008). These parameters can be used to derive the bidirectional reflectance of Itokawa at each channel wavelength, enabling photometric corrections of the Itokawa spectra. Using these parameters, we converted all NIRS spectral data into the reflectance experiment laboratory (RELAB) configuration of i=30°, e=0°, and g=30°, where i, e, and g are the incident zenith, the viewing zenith, and the solar phase angle, respectively. The photometrically corrected radiance factor is given by
 (1)
(1)
where (I/F)NIRS is the original NIRS radiance factor from the NIRS dataset, and (I/F)kitazato is the Itokawa Hapke model radiance factor (Kitazato et al. 2008). i0, e0, and g0 are the incident zenith angle, the viewing zenith angle, and the phase angle, respectively, all of which are provided by the NIRS dataset.
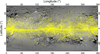 |
Fig. 1 Distribution of the NIRS observation locations. Each point represents the center coordinate of the observation location, as provided in the header file of the NIRS data. The background image is the conformal cylindrical projection map of Itokawa from Stooke (2015). The horizontal belt structure was caused by the fact that the NIRS collected more data near the equator. |
2.2 Laboratory reflectance spectra of meteorites
The surface material of Itokawa closely resembles LL5-6 ordinary chondrites (Abe et al. 2006; Saito et al. 2006; Nakamura et al. 2011). We therefore used the VNIR spectra of Olivenza (LL5) with two size distributions (0-125 μm and 125-500 μm) and Y-74646 (LL6) with three size distributions (0-25 μm, 2545 μm, and 45-75 μm) from RELAB as the fresh sample, as shown in Figs. 2a,b. To account for effects of space weathering in analyzing the Itokawa spectra, we also selected RELAB spectra of the meteorites Appley Bridge (LL6), Chateau Renard (L6), and Hamlet (LL4), which were pristine and irradiated by a pulsed laser at various energy levels, as shown in Figs. 2c-e. Particle size information is not available for these three samples. The RELAB spectra, originally in reflectance factor, were converted to I/F to enable direct comparison with the Hayabusa NIRS data. Pulsed-laser irradiation has been used extensively to simulate micrometeorite impacts, which are one of the primary drivers of space weathering on airless bodies. Although the solar wind may play a more significant role than micrometeorite impacts on asteroids, its simulation is more challenging than that of pulsed-laser irradiation; as a result, experimental data are more abundant for pulsed-laser simulations. Laser irradiation effectively generates nanophase iron (npFe0) and amorphous coatings in meteorite particles, which leads to characteristic spectral changes such as darkening, reddening, and a weakening of absorption bands in the reflectance spectra (Sasaki et al. 2003). The RELAB sample IDs and spectra IDs of these meteorites are listed in Table 1.
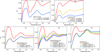 |
Fig. 2 Visible and near-infrared reflectance spectra of ordinary chondrites from RELAB. (a) Olivenza (LL5) with two size distributions: 0125 μm and 125-500 μm. (b) Y-74646 (LL6) with three size distributions: 0-25 μm, 25-45 μm, and 45-75 μm. (c) Appley Bridge (LL6), (d) Chateau Renard (L6), and (e) Hamlet (LL4), each measured in both pristine and pulsed-laser-irradiated states at various energy levels. Particle size information is not available for the last three samples. |
3 Methods
The procedures we used to estimate the surface regolith size distributions of Itokawa are described below. Overall, we first obtained the optical constants of meteorites by fitting a photometric model to RELAB data. We then generated the model reflectance spectra of the LL5 and LL6 meteorites with spaceweathering effects. By comparing the model spectra of grains with different sizes and the Itokawa reflectance spectra measured by NIRS, we inferred the regolith size distributions on Itokawa.
3.1 Fitting the optical constants
To model the reflectance spectra of meteorites, the real and imaginary parts of the refractive index are needed. The wavelengthdependent real part of the refractive index of the host material nh can be expressed as (Hiroi et al. 2006)
 (2)
(2)
where λ is the wavelength in μm.
To derive the imaginary refractive index kh of the host material, we used the equivalent slab model and the Hapke equation (Hapke 2012) to fit the Olivenza and the Y-74646 meteorite spectra shown in Fig. 2. With the reflectance spectra of multiple particle-size distributions and the fixed nh, the only one unknown kh can be obtained by least-squares fitting (Zhuang et al. 2023) using the equations introduced below.
The RELAB spectra were measured at i = 30°, e = 0°, and g = 30° on flat sample surfaces, and opposition and surface roughness effects were therefore neglected. The simplified Hapke reflectance model (Hapke 1981) in radiance factor for host silicate grains is
![Mathematical equation: \left(\frac{I}{F}\right)_h=\frac{\omega_h}{4} \frac{\mu_0}{\mu_0+\mu}[P(g)+H(\mu_0, \omega_h) H(\mu, \omega_h)-1],](/articles/aa/full_html/2025/07/aa53661-25/aa53661-25-eq3.png) (3)
(3)
where μ0 = cos(i), μ = cos(e), and H is the Ambartsumian-Chandrasekhar function, and P(g) is the single-scattering phase function that is approximated by (Lucey 1998)
 (4)
(4)
The single-scattering albedo of the host silicate ωh is approximated by the equivalent slab model as
 (5)
(5)
For particles with an imaginary refractive index 1, the following quantities can be used in Eq. (5):
 (6)
(6)
 (7)
(7)
 (8)
(8)
 (9)
(9)
where sh is the internal scattering coefficient that is estimated to be approximately 0.1 for typical silicate analogs (Zhuang et al. 2023), αh is the absorption coefficient, given by
 (10)
(10)
and 〈D〉 is the effective size of the particles, defined as the average distance traveled by light through the particle without internal scattering. 〈D〉 is related to the geometric diameter D by
![Mathematical equation: \langle D\rangle=\frac{2}{3}\left[n_h^2-\frac{1}{n_h}(n_h^2-1)^\frac{3}{2}\right]D.](/articles/aa/full_html/2025/07/aa53661-25/aa53661-25-eq11.png) (11)
(11)
There are two unknowns, kh and D, in Eqs. (2)–(11), and thus, at least two datasets are needed to solve the equations. As the precise particle-size distribution data (except for the lower and upper bounds) are not available for RELAB meteorites and the accurate determination of optical constants critically depends on the grain size information, we tested a range of particle-size combinations. Specifically, for the 0-125 μm and 125-500 μm Olivenza samples, we varied the model particle size from from 5 to 120 μm and 125-500 μm in 5 μm increments, respectively, which produced 1824 (24×76) size combinations. For each size combination, kh was obtained by fitting the model to RELAB spectra. The size combination and the corresponding kh were then introduced to Eqs. (2)–(11) to generate model spectra. These model spectra were compared with the original RELAB spectra, and the size combination that provided the best match was chosen as the effective particle size of the meteorite samples. The same procedure was applied to the Y-74646 sample with three size distributions. Two spectral matching algorithms that are widely used in remote compositional analysis (e.g., Zhang et al. 2015; Ma et al. 2020), the centered pattern root mean square (CPRMS; Taylor 2001) and the absolute difference (ABS), were used to assess the similarity between the model generated spectra and the RELAB spectra,
![Mathematical equation: CPRMS&=&\sqrt{\frac{1}{N}\sum_{i=1}^N[(t_i-\bar{t})-(r_i-\bar{r})]^2},\\](/articles/aa/full_html/2025/07/aa53661-25/aa53661-25-eq12.png) (12)
(12)
 (13)
(13)
where ti, ri, t̄, and r̄ are the ith data point of the model spectrum, the ith point of the RELAB spectrum, the average value of the model spectrum, and the average of the RELAB spectrum, respectively, and N is the number of data points of the spectrum. Lower values of CPRMS and ABS indicate better similarities between the model and data.
We used both methods because they have complementary capabilities. The CPRMS is better for comparing patterns, while the ABS is better for directly assessing magnitude differences. Specifically, the CPRMS excels at assessing pattern similarity by eliminating the mean bias, which makes it ideal for assessing a spatial structure, but it ignores systematic mean differences. On the other hand, the ABS is simple, robust to outliers, and provides easily interpretable results, but it ignores pattern similarity and scaling. It only focuses on magnitude differences without directional insights. A comparison of the results from both methods helped us to minimize potential bias associated with relying on a single approach and ensured greater objectivity.
For the meteorite spectra, the particle-size combinations determined using the CPRMS and ABS methods differ, as described in Appendix A. As a compromise, the combination of 65 μm and 155 μm was chosen from among the 1824 combinations as the effective size for the two Olivenza samples (0-125 μm and 125-500 μm). For the three Y-74646 samples (0-25 μm, 25-45 μm, and 45-75 μm), the chosen size combination was 15 μm, 30 μm, and 60 μm. These combinations minimized the values of the CPRMS and ABS metrics. Figs. 3a and b present the wavelength-dependent kh obtained through the fitting, while Figs. 3c and d show the model spectra calculated using the fitted kh and the comparisons with the RELAB measurement spectra.
Several factors may contribute to the discrepancies between the model and measurement spectra. First, the RELAB measurements are only available in two or three size distributions, which might introduce errors in retrieving kh . Second, the highly simplified single-scattering (the effective slab model) and multiplescattering models may be inadequate to describe the real-world reflectance. Third, the derived effective particle sizes for the available size distributions may differ from the actual sizes. Additionally, it is possible that the meteorite grains have doublepeak size distributions that cannot be well represented by a single effective particle size. Because of these limitations, our current approach is only semiquantitative. More accurate retrievals may be achieved with more realistic models and additional data in the future.
RELAB sample and spectrum IDs of the meteorite samples.
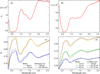 |
Fig. 3 Imaginary part of the refractive index of Olivenza (a) and Y-74646 (b) derived by fitting Eqs. (2)–(11) to RELAB spectra, and comparison of the model spectra using the fitted kh and the corresponding measurement spectra of Olivenza (c) and Y-74646 (d). |
3.2 Generating the model reflectance spectra by incorporating space weathering and retrieving the particle sizes
We then added space-weathering effects to the model spectra. We used the Maxwell-Garnett approximation, which treats space-weathered regolith as mixtures of iron and silicates (Hapke 2001). The single-scattering albedo of the space-weathered particle with nanophase iron added is expressed as
 (14)
(14)
 (15)
(15)
 (16)
(16)
where ssw is the internal scattering coefficient, which we again assumed to be 0.1, and αsw is the absorption coefficient of meteorites with space-weathering effects,
 (17)
(17)
where αFe is the absorption coefficient of the npFe0, given by
 (18)
(18)
with f the mass fraction of the npFe0 estimated to be 0.05 weight percent on Itokawa (Binzel et al. 2001); ρh and ρFe are densities of silicate and iron, and z is
 (19)
(19)
where nFe and kFe are the wavelength-dependent refractive indices of iron (Johnson & Christy 1974). Although spectral modeling shows that different regions of Itokawa may have different npFe0 contents (Hiroi et al. 2006), the particle size affects the spectral features more than the npFe0 content, as shown in Appendix B. We therefore used a uniform npFe0 content to simplify the calculations.
After we obtained ωsw, the model reflectance in radiance factor was given by
![Mathematical equation: \left(\frac{I}{F}\right)_{sw}=\frac{\omega_{sw}}{4} \frac{\mu_0}{\mu_0+\mu}[P(g)+H(\mu_0, \omega_{sw}) H(\mu, \omega_{sw})-1],](/articles/aa/full_html/2025/07/aa53661-25/aa53661-25-eq20.png) (20)
(20)
and the model spectra with space-weathering effects are shown in Fig. 4. The model spectra with space-weathering effects were only generated for four sizes, 10 μm, 50 μm, 100 μm, and 500 μm, in contrast to the finer steps in fitting the meteorite spectra, because our current goal in retrieving the asteroid regolith sizes is semiquantitative. Because the equivalent slab model we used for the single-particle scattering calculations is only valid for particle sizes smaller than 500 μm, the model spectra only reached 500 μm. For simplicity, the effects of amorphous layers on the reflectance spectra were not considered because previous studies showed that adding npFe0 alone would be sufficient to model the space-weathering effects of the Itokawa spectra (Hiroi et al. 2006).
It should be emphasized again that the modeling approach described above is only semiquantitative because a number of simplifications and assumptions were made. In addition to the factors enumerated in Section 3.1, the assumption that space-weathered grains share the same single-scattering phase function as described by Eq. (4), along with the empirical nature of the internal scattering coefficient, may introduce errors. Only a limited number of data is available (Figs. 2a,b), however, so that using more complex models with additional parameters may complicate the size retrieval.
After we obtained the model reflectance spectra of grains with various sizes, we estimated the regolith size distribution on Itokawa by comparing the model spectra with the NIRS spectra. We again used the CPRMS and ABS algorithms (Eqs. (12)–(13)) to evaluate the similarity between the model spectra and those of Itokawa. When the CPRMS/ABS value between the model spectrum of a certain particle size and the Itokawa spectrum was lowest, the size was taken as the model-retrieved particle size at the measurement site on Itokawa. As a result, four particle-size distributions on the Itokawa surface were produced by these two matching algorithms and the spectra of two meteorites.
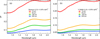 |
Fig. 4 Model reflectance spectra of Olivenza (a) and Y-74646 (b) grains with various diameters with 0.05 weight percent npFe0 added. Each dot in the spectra corresponds to the central wavelength of each NIRS channel. |
3.3 Evaluating the olivine content
Since the particle-size retrieval method is based solely on the size effect on reflectance spectra and may be affected by compositional variations in the regolith on the Itokawa surface, the effects of nonuniformity of mineral distributions on Itokawa must be evaluated. Since the major components of LL5-6 ordinary chondrites are olivine and pyroxene, we derived the relative content of olivine to obtain the mineral composition distributions of Itokawa. Because of the limited spectral coverage and spectral resolution of the NIRS instrument, some empirical methods for estimating olivine content such as the band area ratio (BAR) and the Band I center wavelength methods (Cloutis et al. 1986) cannot be directly applied to NIRS data. Using the reflectance spectral data from RELAB, Nardi et al. (2019) developed a method for estimating mineral content that was tailored for NIRS data. They introduced three parameters: forsterite index (FORx), pyroxene index (Px), and the modified band area ratio (BAR*mod), which are linearly correlated with olivine content. These parameters are defined as
 (21)
(21)
 (22)
(22)
 (23)
(23)
where Rλ is the reflectance at wavelength λ in μm, Band Ib is the band area of the 1 μm absorption, and Band IIb is the area between the left shoulder of the 2 μm absorption to the last wavelength available for NIRS. Nardi et al. (2019) demonstrated that these indices are linearly related with the olivine content in three olivine-pyroxene mixtures: binary mixtures of hypersthene and forsterite, low-calcium ternary mixtures (LCP) consisting of forsterite, hypersthene, and augite with a hypersthene-to-augite ratio of 5.66, and high-calcium ternary mixtures (HCP), which are similar to the LCP mixtures, but have a hypersthene-to-augite ratio of 1. They also found that FORx and Px are only slightly influenced by the particle size in ordinary chondrites, while BAR*mod strongly depends on the size. As previous studies of the olivine abundance on Itokawa (Nardi et al. 2019; Korda et al. 2023) did not consider the effects of space weathering and did not perform photometric corrections, we evaluated the sensitivity of different indices (Eqs. (21)–(23)) to space weathering, and reevaluated the olivine abundance on the Itokawa surface using the photometrically corrected NIRS data. Specifically, we used RELAB spectra of the meteorites Appley Bridge (LL6), Chateau Renard (L6), and Hamlet (LL4) (both pristine and pulsed-laser irradiated (Table 1)), to derive the olivine content indices under different levels of simulated space weathering. Next, we selected the indices with a low sensitivity to space weathering among the three defined above and used them to derive the relative olivine content on Itokawa.
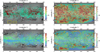 |
Fig. 5 Retrieved particle-size distributions calculated from Olivenza (LL5) spectra overlaid on the conformal cylindrical projection map of Itokawa. (a) Particle size retrieved using the CPRMS algorithm. (b) Same as (a), but interpolated to 3° × 3°. (c) Particle size retrieved using the ABS algorithm. (d) Same as (c), but interpolated to 3° × 3°. The belt-like structure in (c) was caused by the denser data points near the equator, as shown in Fig. 1. The pink box indicates a typical rough terrain, and each of the two yellow boxes indicates a typical smooth terrain. |
4 Results and discussions
4.1 Particle-size distribution on Itokawa
To facilitate a more intuitive comparison between the particle sizes derived from spectral inversions and those mapped on the AMICA cylindrical projection, we applied the Voronoi algorithm to interpolate the particle sizes retrieved from NIRS data. The regolith sizes derived using the CPRMS and ABS algorithms based on the Olivenza (LL5) spectra are shown in Fig. 5, and those based on Y-74646 are shown in Fig. 6. In Fig. 5, the average particle sizes retrieved from all available NIRS data using the CPRMS and the ABS algorithms are 310 μm and 93 μm, respectively; in Fig. 6, the average regolith sizes retrieved using the CPRMS and ABS methods are 25 μm and 42 μm, respectively. This order-of-magnitude difference can be explained as follows. For particles with identical optical constants, an increase in the particle size results in a lower reflectance, whereas a decrease in size leads to higher reflectance due to enhanced multiple scattering (Bohren 1987). The imaginary refractive index retrieved from the RELAB spectra of Y-74646 is higher by approximately an order of magnitude than that from Olivenza (Fig. 3). As a result, for the same NIRS I/F data, the particle sizes inferred using the k value from Y-74646 are lower by about an order of magnitude than those derived using Olivenza. This suggests that the mineral composition has a strong impact on the regolith size retrievals. Therefore, caution is needed when interpreting grain size results. In this section, we first assess the consistency of the spatial distribution patterns of the retrieval results obtained using the CPRMS and ABS matching algorithms. The issue of compositional homogeneity across the surface of Itokawa is addressed in Section 4.3.
We used the structural similarity index measure (SSIM) to assess the local spatial correlation between the two datatsets of the retrieved size (Wang et al. 2004). The SSIM index includes three comparison measurements: luminance, contrast, and structure. To emphasize the structural similarity of the images, we set the coefficient of structural comparison to one and the coefficients of the other two comparisons to zero. This made the local SSIM index of the image equivalent to the Pearson correlation coefficient. Specifically, a 5×5-pixel sliding window was synchronously applied to both grids. At each position, the corresponding window data were extracted, and any window containing more than 75% of blank data was excluded. The average Pearson correlation coefficient across all valid windows was then used as the metric for the global structural similarity between the two spatial datasets. The SSIM indices between the four images derived from the CPRMS and ABS algorithms applied to the LL5 Olivenza (Figs. 5b,d) and the LL6 Y-74646 (Figs. 6b,d) samples are summarized in Table 2. Excluding the four self-correlations, the remaining 12 pairwise comparisons indicate a moderate to strong structural similarity among the images. This suggests that, although the absolute values of the retrieved regolith sizes differ depending on the meteorites and matching algorithm, the spatial distribution patterns across the Itokawa surface are broadly consistent. Among the comparisons, the image derived from the Y-74646 spectra using the ABS algorithm shows the lowest structural similarity with the others. This may be because the model reflectance spectra calculated from Y-74646, with particle sizes between 100 and 500 μm, are quite close to each other (Fig. 4d) due to the large retrieved imaginary refractive index. As a result, the retrieval using the ABS algorithm, which favors the similarity between model and data in absolute values, became an outlier.
In the two largest smooth terrains, MUSES-C Regio at the south pole and Sagamihara Regio at the north pole, the retrieved particle sizes calculated from Olivenza spectra are mostly around 100 μm (CPRMS) and 50 μm (ABS), and the sizes calculated from Y-74646 spectra are mostly around 10 μm, which is smaller than their respective global averages. Since the Itokawa regolith particles collected from MUSES-C Regio have a sphereequivalent diameter of 13.5-114.3 μm with a median value of 33.5 μm (Tsuchiyama et al. 2014), our retrieved grain sizes can be considered plausible.
At several locations inside MUSES-C Regio, the retrieved regolith sizes are significantly larger than the average values in the flat regions. For example, two regions centered around (−75° latitude, 60° longitude) and (−75° latitude, 105° longitude), outlined by the yellow boxes in Fig. 5a, have retrieved regolith sizes of 500 μm. We plot the spectra of these abnormal regions with I/F values lower than approximately 0.08, along with some normal regions with I/F values greater than approximately 0.1 within MUSES-C Regio in Fig. 7. The anomalies may be due to either a difference in mineral composition compared to the surrounding area or to the presence of significantly large rocks in that region, as evidenced in the AMICA background image shown in Fig. 5a.
In most rough terrains, the retrieved particle sizes are larger than the global average values. For example, the rough region centered around (45° latitude, 15° longitude) has an average retrieved regolith size of 360 μm calculated from the spectra of Olivenza and the CPRMS algorithm. Previous studies have suggested that fine regolith smaller than 1 cm may be absent in rough regions, based on AMICA images analyzed by Brunetto et al. (2015). However, the retrieved regolith sizes in most rough terrains are in the range of 100-500 μm from Olivenza and 50-100 μm form Y-74646 based on both algorithms. As mentioned in Section 3.2, the equivalent slab model is only capable of describing scattering by submillimeter grains, and thus, any centimeter-sized and larger gravels cannot be retrieved using this method. Another possibility is that centimeter-sized gravels in these regions may be clumps aggregated by fine-grained materials through cohesion forces (Scheeres et al. 2010; Rivkin 2013). Therefore, the centimeter-sized and larger gravels that can be resolved in the images are retrieved spectroscopically as submillimeter grains. An area centered at 60° latitude and 150° longitude within the rough terrains (outlined by the pink box in Fig. 5a) contains quite a few large rocks (Fig. 5a), whereas the retrieved regolith sizes are very small. Situated at the edge of the fine-grain-dominated Sagamihara Regio, it is likely that the rocks in this region are covered by a thin layer of dust regolith. As the spectral features of fine-grained regolith typically dominate those of the underlying rocks (Pieters et al. 1993; Sun & Lucey 2021), the spectral features of this area resemble regolith rather than the rocks beneath it. In contrast, some rocky areas, such as those near (−30° latitude, 0° longitude) and (−40° latitude, 180° longitude), have large retrieved grain sizes, suggesting they are likely not covered by regolith. These regions, located at the tips of the head and body of Itokawa, correspond to areas with a high gravitational potential (Tancredi et al. 2015). Because the equivalent slab model we used for single-particle scattering calculations (Eq. (4)) is only valid for particle sizes smaller than 500 μm (Hapke 2012; Zhuang et al. 2023), the retrieved sizes in these rocky regions are capped at 500 μm, which may be smaller than the actual particle sizes.
Although the absolute regolith sizes retrieved from spectroscopic methods differ from those obtained through the image analysis, the clear dichotomy in retrieved particle sizes between smooth and rough terrains in most regions highlights a strong correlation between particle size and spectral features. This suggests that the retrieval method employed in this study is at least semiquantitatively reliable.
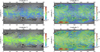 |
Fig. 6 Retrieved particle-size distributions calculated from Y-74646 (LL6) spectra overlaid on the conformal cylindrical projection map of Itokawa. (a) Particle size retrieved using the CPRMS algorithm. (b) Same as (a), but interpolated to 3° × 3°. (c) Particle size retrieved using the ABS algorithm. (d) Same as (c), but interpolated to 3° × 3°. |
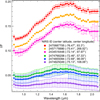 |
Fig. 7 Comparisons between the spectra with normal reflectance values (spectrum IDs 2470687705, 2457178880, and 2434516448) and those with abnormal reflectance values (spectrum IDs 2474768208, 2474855084, and 2474825049) within MUSES-C Regio, where the retrieved regolith sizes are smaller than the global average. |
4.2 Spectral feature analysis
Our recent studies of igneous rocks and their powders showed that the spectral parameters are particle-size dependent (Zhuang et al. 2023). For brighter rocks with I/F (0.5 μm) greater than 0.09, the VNIR spectra of their powders exhibited higher reflectance values and a redder spectral slope than their slab counterparts. In the continuum-removed spectra, the band depth and band area first increased with particle size and then remained constant after reaching a certain threshold. Building on these findings, we analyzed the spectral characteristics of the Itokawa surface, including brightness, spectral slope, and the absorption band depth and area, to validate the particle-size retrieval results. This approach is justified because the Itokawa surface falls into the category of the brighter samples in our igneous rock study. Specifically, the average radiance factor between 0.85 and 2.08 μm and the spectral slope between 1.0 and 1.45 μm were calculated for each photometrically corrected NIRS spectrum. The 1 μm band depth and band area were derived from the continuum-removed spectra, with the calculation method detailed in Appendix C. Fig. 8 presents the global maps of these four spectral parameters, all interpolated to 3° × 3° via the Voronoi algorithm.
The results indicate that the average radiance factor values in flat terrains, such as MUSES-C and Sagamihara Regio, are higher than those in most other regions. The spectral slope values have the same variation pattern as the average radiance factor values. These two features are consistent with the size retrieval results that the particles in these flat terrains are smaller. The band depth and band area values in the flat terrain are lower than those of the rough terrain. These two absorption feature maps (Figs. 8c, d) clearly highlight the dichotomy of the surface terrain on Itokawa, a pattern that is attributable to the saturation of absorption band depth and area beyond a certain particlesize threshold (Zhuang et al. 2023). The variation patterns of the spectral parameters of Itokawa indicate the effectiveness of the particle-size retrieval method.
4.3 Mineral composition analysis
As mentioned in Section 4.1, the surface composition had an impact on the size retrieval results. We examined the homogeneity of the mineral composition across the Itokawa surface. As described in Section 3.3, we used RELAB spectra of the meteorites Appley Bridge (LL6), Chateau Renard (L6), and Hamlet (LL4) (Figs. 2b-d) in pristine and laser-irradiated states to derive three spectral indices related to olivine content: FORx, Px, and BAR*mod. The results in Table 3 show that of the three indices, BAR*Mod is the most sensitive to space weathering, whereas FORx and Px are comparatively less affected.
Based on the above results, we estimated the relative content of olivine on Itokawa by calculating the FORx and Px indices from the photometrically corrected NIRS spectra. Since the analysis of the returned sample showed that Itokawa contains a higher abundance of low-Ca pyroxene (LCP) compared to high-Ca pyroxene (HCP) (Tsuchiyama et al. 2014), the LCP mixtures were considered more representative of the Itokawa surface. Therefore, we present only the olivine/(olivine+pyroxene) values derived using the linear relations between FORx/Px and the olivine content in LCP mixtures (Section 3.3), and the results are shown in Fig. 9.
Except for a few areas with abnormal spectra, such as those shown in Fig. 7, the olivine/(olivine+pyroxene) ratios are mostly between 75% and 85%, suggesting that the surface mineralogy of Itokawa is likely more homogeneous than was previously thought (Nardi et al. 2019; Korda et al. 2023). Therefore, the spectral variations observed in different regions of Itokawa are likely primarily caused by differences in particle-size distributions and not by variations in the mineralogical composition.
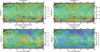 |
Fig. 8 Distributions of the spectral features of Itokawa: (a) Average radiance factor, (b) spectral slope between 1-1.45 μm, (c) 1 μm band depth, and (d) 1 μm band area. Each pixel represents an area of 3° × 3°. |
5 Conclusions
Based on RELAB reflectance spectra of LL5 Olivenza and LL6 Y-74646 meteorites with varying grain size distributions and accounting for the effects of space weathering, we constructed model reflectance spectra for asteroid Itokawa for a range of particle sizes. By matching the model spectra to photometricaly corrected Hayabusa NIRS measurements of the Itokawa surface using two independent algorithms, we estimated that the average regolith particle size ranges from 25 to 310 μm. Specifically, rough terrains are dominated by particles of approximately 50-500 μm, while flat terrains contain finer grains of about 10-100 μm. This is consistent with samples returned from the MUSES-C Regio. Although the absolute grain sizes retrieved by the two methods differ by up to an order of magnitude, the overall spatial trends are very similar. This demonstrates the effectiveness of our semiquantitative retrieval approach.
Spectral analysis in conjunction with global imagery revealed that fine-grained regions exhibit higher average reflectance and steeper spectral slopes, but shallower bands and a smaller band area. In contrast, rock-rich areas display a lower reflectance and spectral slopes, but deeper absorption features. These trends agree with the retrieved grain size distribution. Further investigation using a spectral index sensitive to olivine content, derived from photometrically corrected NIRS data, suggested that the mineral composition on the Itokawa surface is largely homogeneous. This indicates that the observed spectral variations are primarily caused by differences in the particle size and not by compositional heterogeneity.
These results support the feasibility of retrieving regolith grain size from VNIR spectra for asteroids with uniform surface compositions such as Itokawa. For bodies with more heterogeneous surfaces, however, the coupling of compositional and grain size effects poses a significant challenge, particularly given the inability of current photometric models to separate the two. As future missions return more spectral reflectance data from small Solar System bodies, our method offers a promising framework for a broader application, provided that advancements in modeling densely packed regolith reflectance and separating the effects of composition and grain size continue to progress.
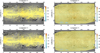 |
Fig. 9 Weight percent values of olivine/(olivine+pyroxene) obtained using FORx (a) and Px (c), and the corresponding 3° × 3 ° interpolation diagram (b and d). |
Acknowledgements
We thank Ma Pei and Zhuang Yan for help in data reductions. Useful comments from an anonymous reviewer and editor Emmanuel Lellouch helped improve the quality of the manuscript. Supports from the National Science Foundation of China (12373067, 12073024) and Macau University of Science and Technology (SKL-LPS(MUST)-2021-2023) are gratefully acknowledged.
Appendix A Effects of Olivenza meteorite particle sizes on the retrieved optical constant k
The imaginary refractive index k retrieved from reflectance spectra is sensitive to the particle size D used in the equivalent slab model (Eqs. (5–11)). Taking Olivenza as an example, Since the only size information available for the two Olivena meteorite powders is the lower and upper limits of the grains, 0-125 μm and 125-500 μm, respectively, the effective particle sizes D1 and D2 for the two samples were obtained as fitting results, together with k1 and k2. The two model-measurement matching algorithms, the CPRMS and the ABS (Eqs.(12–13)), produced two sets of (k1, D1) and (k2, D2), as shown in Fig. A.1. Specifically, the CPRMS yielded a size combination (D1 = 45 μm, D2 = 125 μm, Fig. A.1b), the the ABS yielded (D1 = 120 μm, D2 = 315 μm, Fig. A.1d). Obviously, the comparisons of Fig. A.1b and d show that the model spectra produced by the ABS method are closer to measurements. However, the fittings were based on two datasets only, and as mentioned in Section 3.1, we wish to account for both the magnitude difference and spectral patterns. Therefore, we selected a size combination (D1 = 65 μm, D2 = 155 μm), that produced minimal values for both the CPRMS and ABS methods among all 1824 size combinations. By using this size combination, the imaginary refractive index k shown in Fig. 3 was obtained.
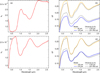 |
Fig. A.1 The imaginary refractive index k and the model r.e-constructed reflectance spectra for the Olivenza grains with two size distributions. Results in (a) and (b) were generated using the CPRMS method, while those in (c) and (d) were generated using the ABS method. (a) k obtained by using the CPRMS matching method. (b) Comparisons of the model spectra and the RELAB spectra. The model spectra were obtained using k shown in (a) and (D1 = 45 μm, D2 = 125 μm) that returned the minimum CPRMS value. (c) k obtained by using the CPRMS matching method. (d) Comparison of the model spectra and the RELAB spectra. The model spectra were obtained using k shown in (c) and (D1 = 120 μm, D2 = 315 μm) that returned the minimum ABS value. |
Appendix B Effects of varying particle size and nano-phase iron content
Here we take Olivenza as an example and show that the changes in particle size have a more dominant effects than changing the nano-phase iron content, all in steps used in the main text. Fig. B.1 shows the model spectra with different particle sizes and different npFe0 contents. Obviously, variations in particle sizes in the steps shown here have a more significant impact on the spectra than changes in npFe0 content within a reasonable range. Fig. B.2 was generated by matching the model spectra shown in Fig. B.1 with the Itokawa spectra using the CPRMS and ABS algorithms, followed by interpolations to match the AMICA image. The results shown in Fig. B.1 closely resemble those shown in Fig. 5. This allowed us to use a constant npFe0 value of 0.05 weight percent in generating the space-weathered model spectra to simplify the size retrievals.
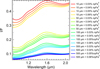 |
Fig. B.1 Model model spectra of Itokawa regolith grains with different sizes and different contents of npFe0. |
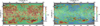 |
Fig. B.2 (a) Global distributions of regolith grain sizes obtained by matching the Itokawa spectra and the model spectra shown in Fig B.1 using the CPRMS algorithm. (b) Same as (a) but using the ABS matching algorithm. In both cases,interpolations were performed to match the AMICA image. |
Appendix C Continuum removal
In this work, we used the spectral envelope polyline as the reflectance continuum. We first connected the first (0.858 μm) and second (0.881 μm) data points of the NIRS spectrum and extend all the way to the last data point (2.083 μm). If the resulting line is lower than the reflectance at some subsequent wavelengths, the second data point is replaced by the third data point and then extended to the last data point, and so on, until the line obtained is higher than or equal to all data points in the spectrum. Then, the line segment connecting the first data point and the current data point is taken as the envelope between these two points. Next, the current second data point is used as the first data point of the next line segment, and process goes on until the last data point in the spectrum is reached. Once all line segments are obtained, the continuum-removed spectrum is obtained by taking the ratio of the original spectrum and the continuum.
The absorption band depth (BD) and band area (BAR) are obtained as
 (C.1)
(C.1)
 (C.2)
(C.2)
where BCcr is the reflectance value of the continuum-removed spectrum at the band center wavelength, the reflectance value of the continuum-removed spectrum; λ0 and λ1 are the starting and ending points of the absorption, respectively.
 |
Fig. C.1 The original Itokawa spectrum (spectral ID 2394652768) and the corresponding continuum-removed spectrum. (a) The photometrically corrected Itokawa spectrum, (red) the continuum obtained by the method described above (black polyline). (b) The continuum-removed spectrum obtained by ratioing the original spectrum and the continuum. |
References
- Abe, M., Takagi, Y., Kitazato, K., et al. 2006, Science, 312, 1334 [Google Scholar]
- Abe, M., Takagi, Y., Abe, S., & Kitazato, K. 2011, Instrument calibration of the Hayabusa near-infrared spectrometer, Tech. rep. (Japan Aerospace Exploration Agency) [Google Scholar]
- Beck, P., Pommerol, A., Thomas, N., et al. 2012, Icarus, 218, 364 [CrossRef] [Google Scholar]
- Binzel, R. P., Rivkin, A. S., Bus, S. J., Sunshine, J. M., & Burbine, T. H. 2001, Meteorit. Planet. Sci., 36, 1167 [Google Scholar]
- Bohren, C. F. 1987, Am. J. Phys., 55, 524 [Google Scholar]
- Bowen, B., Reddy, V., De Florio, M., et al. 2023, Planet. Sci. J., 4, 52 [Google Scholar]
- Brunetto, R., Loeffler, M. J., Nesvornÿ, D., Sasaki, S., & Strazzulla, G. 2015, in Asteroids IV, eds. P. Michel, F. E. DeMeo, & W. F. Bottke (Tucson, AZ: University of Arizona Press), 597 [Google Scholar]
- Burke, K. N., DellaGiustina, D. N., Bennett, C. A., et al. 2021, Remote Sens., 13, 1315 [Google Scholar]
- Cantillo, D. C., Reddy, V., Battle, A., et al. 2023, Planet. Sci. J., 4, 177 [Google Scholar]
- Cloutis, E. A., Gaffey, M. J., Jackowski, T. L., & Reed, K. L. 1986, J. Geophys. Res. Solid Earth, 91, 11641 [CrossRef] [Google Scholar]
- Emery, J., Fernández, Y., Kelley, M., et al. 2014, Icarus, 234, 17 [NASA ADS] [CrossRef] [Google Scholar]
- Fujiwara, A., Kawaguchi, J., Yeomans, D., et al. 2006, Science, 312, 1330 [NASA ADS] [CrossRef] [Google Scholar]
- Hapke, B. 1981, J. Geophys. Res. Solid Earth, 86, 3039 [NASA ADS] [CrossRef] [Google Scholar]
- Hapke, B. 2001, J. Geophys. Res. Planets, 106, 10039 [CrossRef] [Google Scholar]
- Hapke, B. 2002, Icarus, 157, 523 [NASA ADS] [CrossRef] [Google Scholar]
- Hapke, B. 2012, Theory of Reflectance and Emittance Spectroscopy (Cambridge university press) [Google Scholar]
- Hiroi, T., Pieters, C. M., & Takeda, H. 1994, Meteorit. Planet. Sci., 29, 394 [Google Scholar]
- Hiroi, T., Abe, M., Kitazato, K., et al. 2006, Nature, 443, 56 [CrossRef] [Google Scholar]
- Johnson, P., & Christy, R. 1974, Phys. Rev. B, 9, 5056 [NASA ADS] [CrossRef] [Google Scholar]
- Kitazato, K., Clark, B. E., Abe, M., et al. 2008, Icarus, 194, 137 [Google Scholar]
- Korda, D., Kohout, T., Flanderová, K., Vincent, J.-B., & Penttilä, A. 2023, A&A, 675, A50 [NASA ADS] [CrossRef] [EDP Sciences] [Google Scholar]
- Lucey, P. G. 1998, J. Geophys. Res. Planets, 103, 1703 [NASA ADS] [CrossRef] [Google Scholar]
- Ma, P., Sun, Y., Zhu, M.-H., et al. 2020, Icarus, 350, 113901 [Google Scholar]
- Müller, T., Sekiguchi, T., Kaasalainen, M., Abe, M., & Hasegawa, S. 2005, A&A, 443, 347 [NASA ADS] [CrossRef] [EDP Sciences] [Google Scholar]
- Nakamura, T., Noguchi, T., Tanaka, M., et al. 2011, Science, 333, 1113 [NASA ADS] [CrossRef] [Google Scholar]
- Nardi, L., Palomba, E., Longobardo, A., Galiano, A., & Dirri, F. 2019, Icarus, 321, 14 [Google Scholar]
- Ni, C., Sun, Y., Zhang, H., & Huang, Y. 2024, J. Quant. Spectrosc. Radiat. Transf., 326, 109109 [Google Scholar]
- Ody, A., Poulet, F., Bibring, J., et al. 2013, J. Geophys. Res. Planets, 118, 234 [Google Scholar]
- Pieters, C. M., & Noble, S. K. 2016, J. Geophys. Res. Planets, 121, 1865 [CrossRef] [Google Scholar]
- Pieters, C. M., Fischer, E. M., Rode, O., & Basu, A. 1993, J. Geophys. Res. Planets, 98, 20817 [Google Scholar]
- Poulet, F., Gomez, C., Bibring, J.-P., et al. 2007, J. Geophys. Res. Planets, 112 [Google Scholar]
- Rivkin, A. 2013, in Planets, Stars and Stellar Systems: Volume 3: Solar and Stellar Planetary Systems, eds. T. D. Oswalt, L. M. French, & P. Kalas (Dordrecht: Springer), 375 [Google Scholar]
- Saito, J., Miyamoto, H., Nakamura, R., et al. 2006, Science, 312, 1341 [NASA ADS] [CrossRef] [Google Scholar]
- Sasaki, S., Kurahashi, E., Yamanaka, C., & Nakamura, K. 2003, Adv. Space Res., 31, 2537 [Google Scholar]
- Scheeres, D. J., Hartzell, C. M., Sánchez, P., & Swift, M. 2010, Icarus, 210, 968 [NASA ADS] [CrossRef] [Google Scholar]
- Stooke, P. 2015, Stooke Small Bodies Maps V3.0, https://pds.nasa.gov/ds-view/pds/viewDataset.jsp?dsid=MULTI-SA-MULTI-6-STOOKEMAPS-V3.0 [Google Scholar]
- Sugita, S., Honda, R., Morota, T., et al. 2019, Science, 364, eaaw0422 [Google Scholar]
- Sun, L., & Lucey, P. G. 2021, J. Geophys. Res. Planets, 126, e2020JE006691 [Google Scholar]
- Tancredi, G., Roland, S., & Bruzzone, S. 2015, Icarus, 247, 279 [NASA ADS] [CrossRef] [Google Scholar]
- Taylor, K. E. 2001, J. Geophys. Res. Atmospheres, 106, 7183 [Google Scholar]
- Tsuchiyama, A., Uesugi, M., Uesugi, K., et al. 2014, Meteorit. Planet. Sci., 49, 172 [Google Scholar]
- Wang, Z., Bovik, A. C., Sheikh, H. R., & Simoncelli, E. P. 2004, IEEE Trans. Image Process., 13, 600 [Google Scholar]
- Zhang, H., Yang, Y., Yuan, Y., et al. 2015, Geophys. Res. Lett., 42, 6945 [Google Scholar]
- Zhuang, Y., Zhang, H., Ma, P., et al. 2023, Icarus, 391, 115346 [Google Scholar]
All Tables
All Figures
|
Fig. 1 Distribution of the NIRS observation locations. Each point represents the center coordinate of the observation location, as provided in the header file of the NIRS data. The background image is the conformal cylindrical projection map of Itokawa from Stooke (2015). The horizontal belt structure was caused by the fact that the NIRS collected more data near the equator. |
| In the text | |
|
Fig. 2 Visible and near-infrared reflectance spectra of ordinary chondrites from RELAB. (a) Olivenza (LL5) with two size distributions: 0125 μm and 125-500 μm. (b) Y-74646 (LL6) with three size distributions: 0-25 μm, 25-45 μm, and 45-75 μm. (c) Appley Bridge (LL6), (d) Chateau Renard (L6), and (e) Hamlet (LL4), each measured in both pristine and pulsed-laser-irradiated states at various energy levels. Particle size information is not available for the last three samples. |
| In the text | |
|
Fig. 3 Imaginary part of the refractive index of Olivenza (a) and Y-74646 (b) derived by fitting Eqs. (2)–(11) to RELAB spectra, and comparison of the model spectra using the fitted kh and the corresponding measurement spectra of Olivenza (c) and Y-74646 (d). |
| In the text | |
|
Fig. 4 Model reflectance spectra of Olivenza (a) and Y-74646 (b) grains with various diameters with 0.05 weight percent npFe0 added. Each dot in the spectra corresponds to the central wavelength of each NIRS channel. |
| In the text | |
|
Fig. 5 Retrieved particle-size distributions calculated from Olivenza (LL5) spectra overlaid on the conformal cylindrical projection map of Itokawa. (a) Particle size retrieved using the CPRMS algorithm. (b) Same as (a), but interpolated to 3° × 3°. (c) Particle size retrieved using the ABS algorithm. (d) Same as (c), but interpolated to 3° × 3°. The belt-like structure in (c) was caused by the denser data points near the equator, as shown in Fig. 1. The pink box indicates a typical rough terrain, and each of the two yellow boxes indicates a typical smooth terrain. |
| In the text | |
|
Fig. 6 Retrieved particle-size distributions calculated from Y-74646 (LL6) spectra overlaid on the conformal cylindrical projection map of Itokawa. (a) Particle size retrieved using the CPRMS algorithm. (b) Same as (a), but interpolated to 3° × 3°. (c) Particle size retrieved using the ABS algorithm. (d) Same as (c), but interpolated to 3° × 3°. |
| In the text | |
|
Fig. 7 Comparisons between the spectra with normal reflectance values (spectrum IDs 2470687705, 2457178880, and 2434516448) and those with abnormal reflectance values (spectrum IDs 2474768208, 2474855084, and 2474825049) within MUSES-C Regio, where the retrieved regolith sizes are smaller than the global average. |
| In the text | |
|
Fig. 8 Distributions of the spectral features of Itokawa: (a) Average radiance factor, (b) spectral slope between 1-1.45 μm, (c) 1 μm band depth, and (d) 1 μm band area. Each pixel represents an area of 3° × 3°. |
| In the text | |
|
Fig. 9 Weight percent values of olivine/(olivine+pyroxene) obtained using FORx (a) and Px (c), and the corresponding 3° × 3 ° interpolation diagram (b and d). |
| In the text | |
|
Fig. A.1 The imaginary refractive index k and the model r.e-constructed reflectance spectra for the Olivenza grains with two size distributions. Results in (a) and (b) were generated using the CPRMS method, while those in (c) and (d) were generated using the ABS method. (a) k obtained by using the CPRMS matching method. (b) Comparisons of the model spectra and the RELAB spectra. The model spectra were obtained using k shown in (a) and (D1 = 45 μm, D2 = 125 μm) that returned the minimum CPRMS value. (c) k obtained by using the CPRMS matching method. (d) Comparison of the model spectra and the RELAB spectra. The model spectra were obtained using k shown in (c) and (D1 = 120 μm, D2 = 315 μm) that returned the minimum ABS value. |
| In the text | |
|
Fig. B.1 Model model spectra of Itokawa regolith grains with different sizes and different contents of npFe0. |
| In the text | |
|
Fig. B.2 (a) Global distributions of regolith grain sizes obtained by matching the Itokawa spectra and the model spectra shown in Fig B.1 using the CPRMS algorithm. (b) Same as (a) but using the ABS matching algorithm. In both cases,interpolations were performed to match the AMICA image. |
| In the text | |
|
Fig. C.1 The original Itokawa spectrum (spectral ID 2394652768) and the corresponding continuum-removed spectrum. (a) The photometrically corrected Itokawa spectrum, (red) the continuum obtained by the method described above (black polyline). (b) The continuum-removed spectrum obtained by ratioing the original spectrum and the continuum. |
| In the text | |
Current usage metrics show cumulative count of Article Views (full-text article views including HTML views, PDF and ePub downloads, according to the available data) and Abstracts Views on Vision4Press platform.
Data correspond to usage on the plateform after 2015. The current usage metrics is available 48-96 hours after online publication and is updated daily on week days.
Initial download of the metrics may take a while.