Fig. 1
Download original image
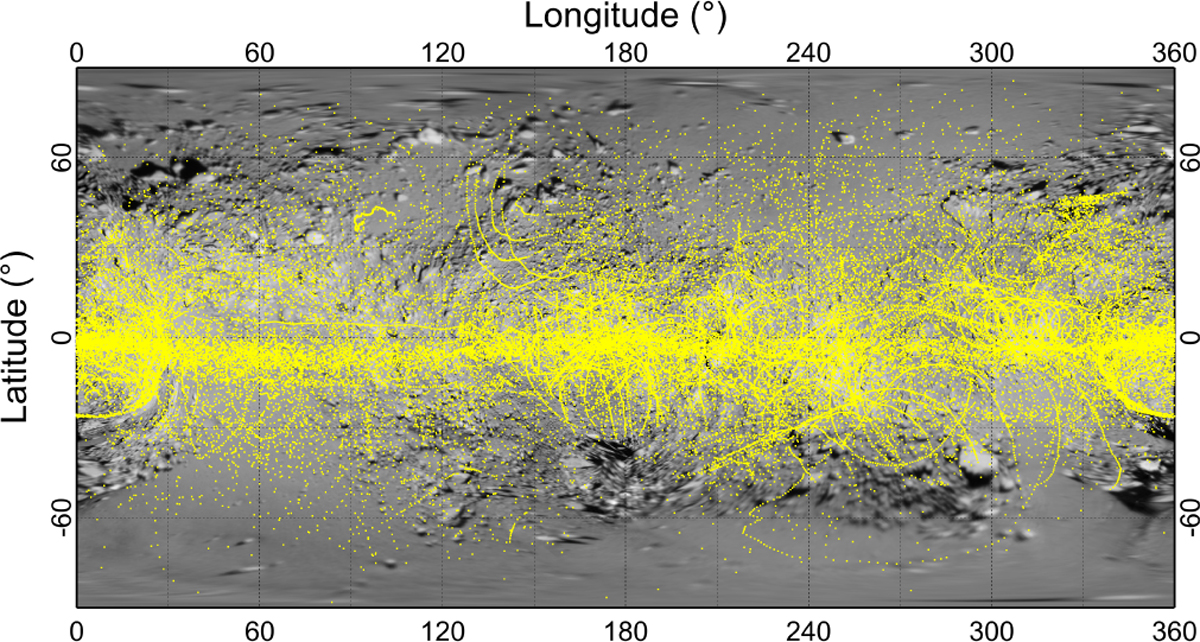
Distribution of the NIRS observation locations. Each point represents the center coordinate of the observation location, as provided in the header file of the NIRS data. The background image is the conformal cylindrical projection map of Itokawa from Stooke (2015). The horizontal belt structure was caused by the fact that the NIRS collected more data near the equator.
Current usage metrics show cumulative count of Article Views (full-text article views including HTML views, PDF and ePub downloads, according to the available data) and Abstracts Views on Vision4Press platform.
Data correspond to usage on the plateform after 2015. The current usage metrics is available 48-96 hours after online publication and is updated daily on week days.
Initial download of the metrics may take a while.