Fig. 5
Download original image
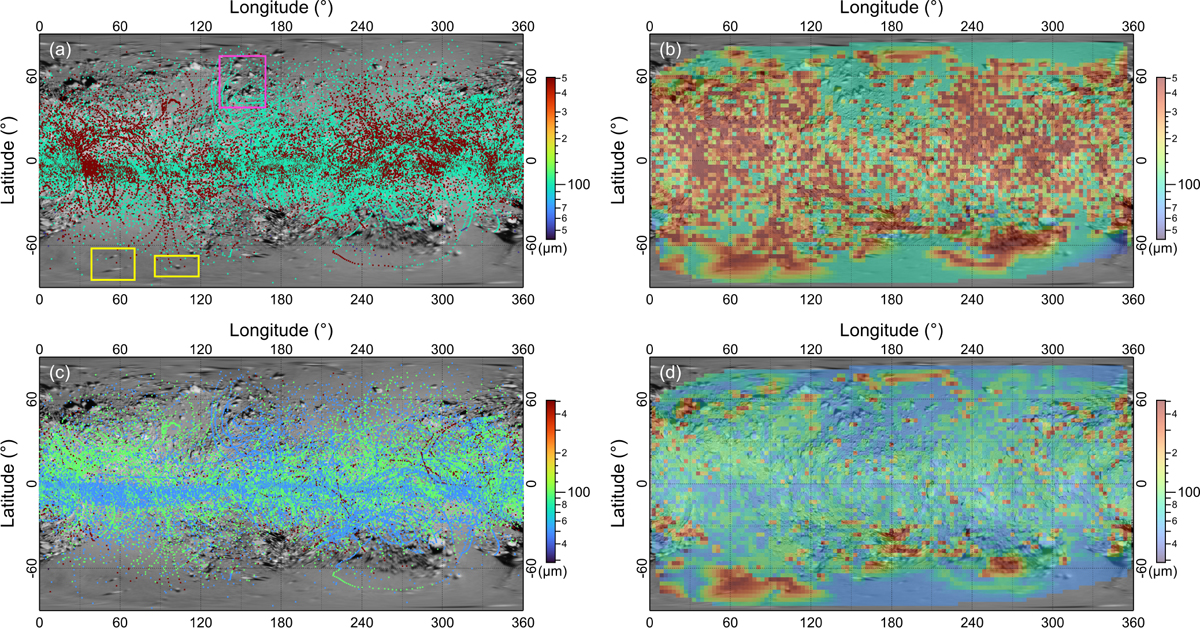
Retrieved particle-size distributions calculated from Olivenza (LL5) spectra overlaid on the conformal cylindrical projection map of Itokawa. (a) Particle size retrieved using the CPRMS algorithm. (b) Same as (a), but interpolated to 3° × 3°. (c) Particle size retrieved using the ABS algorithm. (d) Same as (c), but interpolated to 3° × 3°. The belt-like structure in (c) was caused by the denser data points near the equator, as shown in Fig. 1. The pink box indicates a typical rough terrain, and each of the two yellow boxes indicates a typical smooth terrain.
Current usage metrics show cumulative count of Article Views (full-text article views including HTML views, PDF and ePub downloads, according to the available data) and Abstracts Views on Vision4Press platform.
Data correspond to usage on the plateform after 2015. The current usage metrics is available 48-96 hours after online publication and is updated daily on week days.
Initial download of the metrics may take a while.