Fig. 9
Download original image
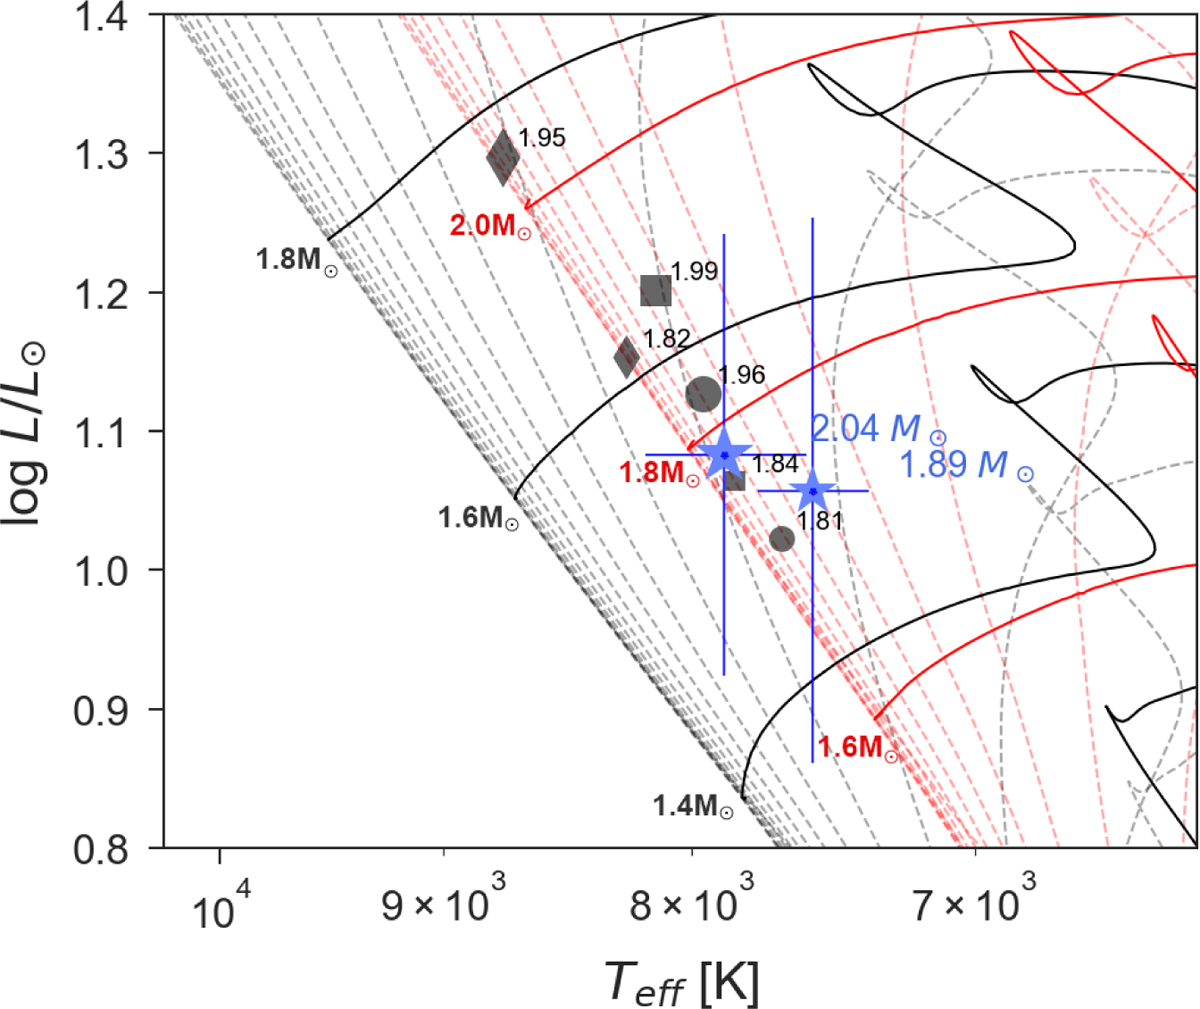
HR diagram showing the position of WW Aur components. Literature solutions are shown with grey symbols, where circles, squares, and diamonds correspond to columns in Table 3 respectively. The solution obtained in this study is shown with blue symbols and error bars. Black lines show solar-scaled MIST evolutionary tracks and isochrones for Z = 0.014, while red lines show tracks and isochrones for enhanced metallicity Z = 0.06. The dynamical masses corresponding to each point are indicated as text labels. We emphasise that the evolutionary tracks are plotted here for illustrative purposes only and they were not used in the parameter derivation within our framework.
Current usage metrics show cumulative count of Article Views (full-text article views including HTML views, PDF and ePub downloads, according to the available data) and Abstracts Views on Vision4Press platform.
Data correspond to usage on the plateform after 2015. The current usage metrics is available 48-96 hours after online publication and is updated daily on week days.
Initial download of the metrics may take a while.