Fig. 5
Download original image
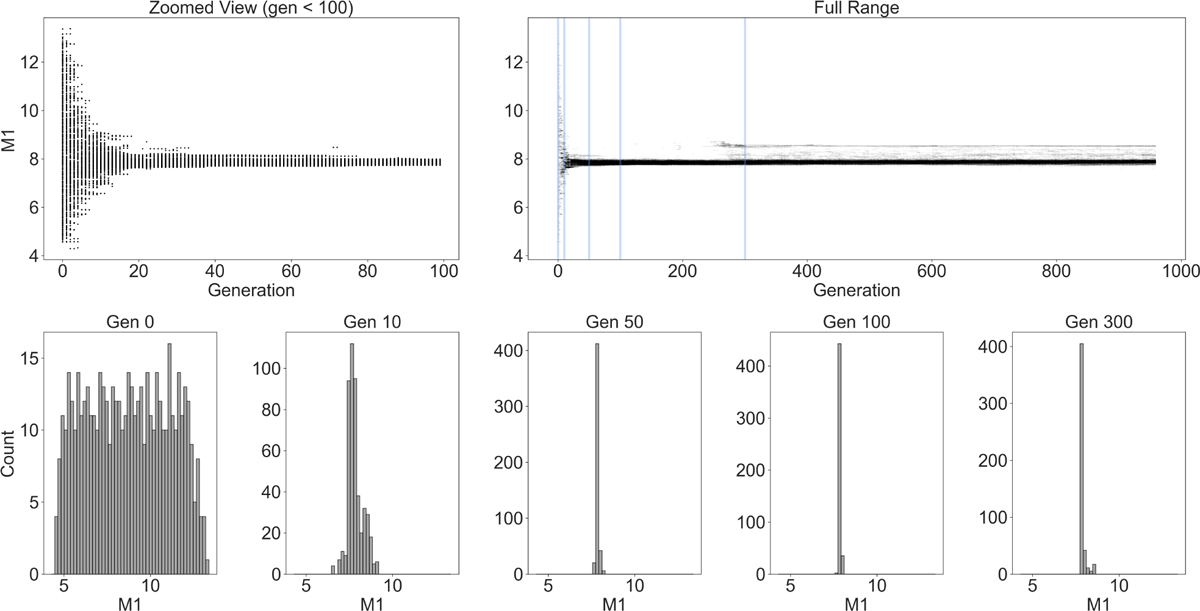
Evolution of the primary’s mass distribution along the population during optimisation for the B5+B7 artificial system. Top row: value of the primary’s mass for a single individual in the population, with populations evolving as the generation number increases. The left and right panels show a zoom into the first 100 generations and the full evolution, respectively. Blue vertical lines in the right panel indicate the positions of the slices shown in the bottom panels. Bottom row: slices in the form of histograms for generations 0, 10, 50, 100, and 300 indicated with blue vertical lines in the top right panel.
Current usage metrics show cumulative count of Article Views (full-text article views including HTML views, PDF and ePub downloads, according to the available data) and Abstracts Views on Vision4Press platform.
Data correspond to usage on the plateform after 2015. The current usage metrics is available 48-96 hours after online publication and is updated daily on week days.
Initial download of the metrics may take a while.