Fig. 4
Download original image
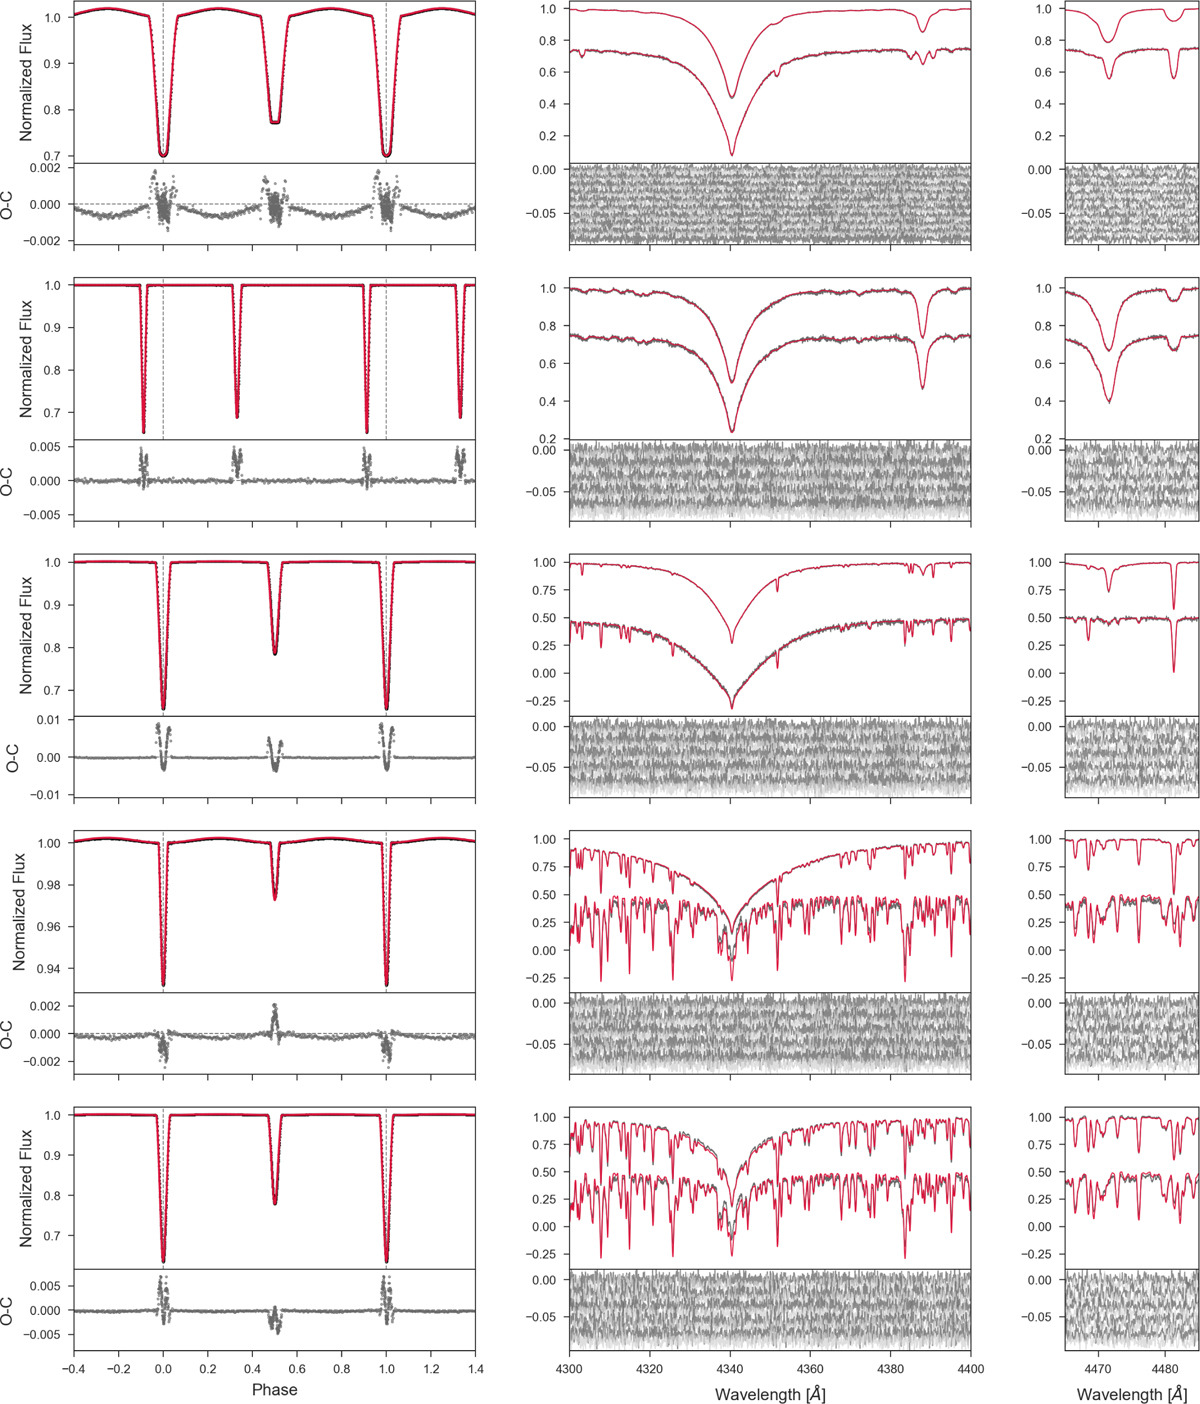
Optimised solutions for all five artificial binary systems. From top to bottom: model systems as referred in the text and Table 1, from B5+B7 to F2+G0. Left column: binned model (red) versus noised and binned ‘observed’ (dark grey) light curves with the residuals beneath. Note: residuals inside eclipses appear more noisy due to eclipse over-sampling during the binning process. Middle and right columns: disentangled spectra of both components (dark grey) and best fit synthetic spectra (red) in two wavelength regions; there is a wider range with the Hγ line (middle) and a zoom into the region with the magnesium 4481Å and the helium 4471 Å (for hotter stars) spectral lines (right). Disentangled spectra of the primary and secondary are shifted vertically for better visibility, residuals are shown beneath.
Current usage metrics show cumulative count of Article Views (full-text article views including HTML views, PDF and ePub downloads, according to the available data) and Abstracts Views on Vision4Press platform.
Data correspond to usage on the plateform after 2015. The current usage metrics is available 48-96 hours after online publication and is updated daily on week days.
Initial download of the metrics may take a while.