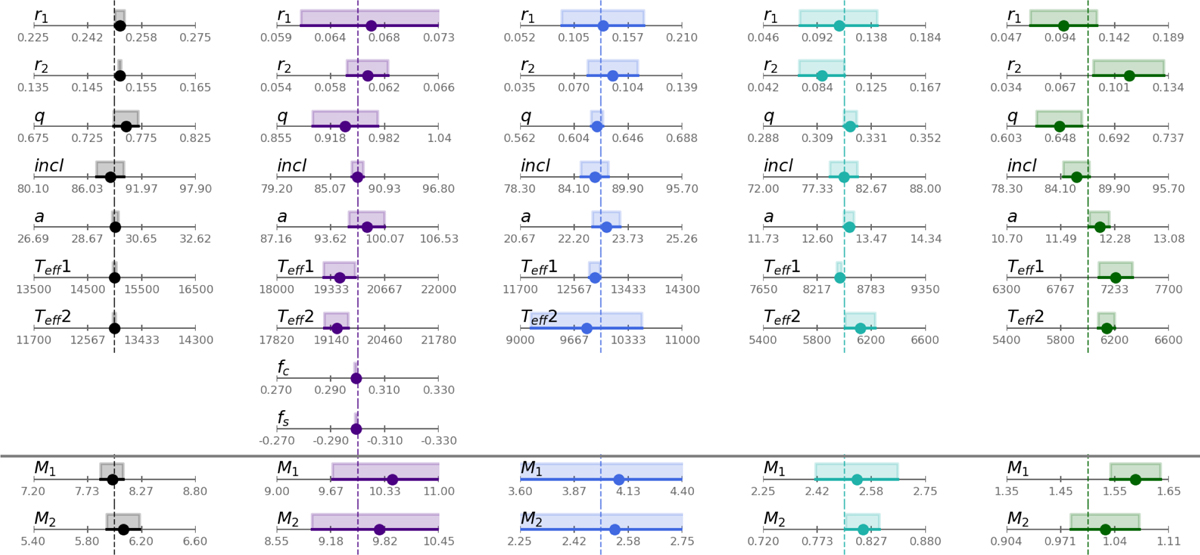
Fig. 3
Download original image
Results of the tests on model data presented as deviations of the found solution from true parameters of the model. Left to right: model systems referred to in the text and Table 1, from B5+B7 to F2+G0. The dashed vertical lines show the true value of each optimised parameter. The value found by the optimiser and the associated 1σ confidence interval are shown with the filled circle and shaded area, respectively. Each axis has a range of ±10% of true value so that the deviations may be visually compared between parameters and systems. An exception is made for the r1 and r2 pair of parameters for the last three systems, where axes had to be extended to accommodate large error bars (the numerical axes ticks should be used as guidance for these systems). Note: the masses of components are not optimised, they are computed from the optimised orbital parameters.
Current usage metrics show cumulative count of Article Views (full-text article views including HTML views, PDF and ePub downloads, according to the available data) and Abstracts Views on Vision4Press platform.
Data correspond to usage on the plateform after 2015. The current usage metrics is available 48-96 hours after online publication and is updated daily on week days.
Initial download of the metrics may take a while.