Fig. C.1
Download original image
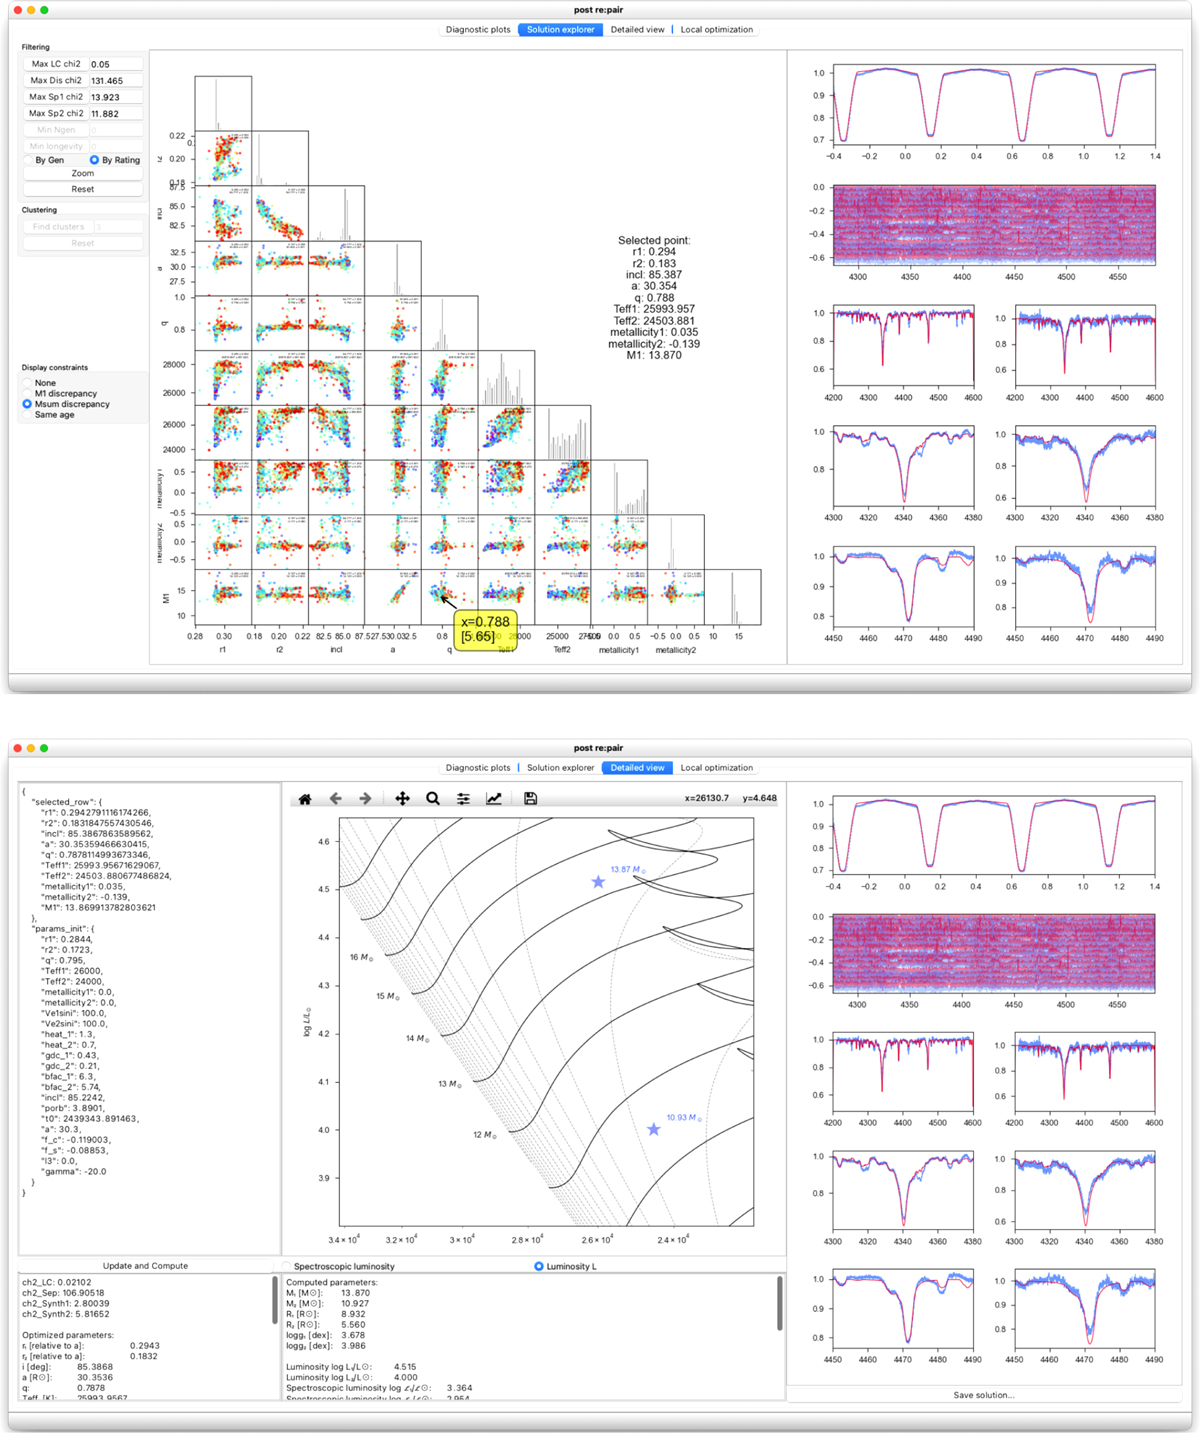
Screenshots of the post-processing GUI. Top panel: a model-informed solution selection during post-process after multi-objective optimisation. Optional colour-coding according to the mass discrepancy and age difference allows for the determination of the region preferred by the model in the parameter space. An interactive selection of any point of interest allows us to compute the corresponding data fit on-the-fly: the light curve, spectral disentangling, and spectral fitting. Bottom panel: Detailed view of any selected point, that also allows for manual variation of the parameters or an automated local weighted optimisation (in a separate tab).
Current usage metrics show cumulative count of Article Views (full-text article views including HTML views, PDF and ePub downloads, according to the available data) and Abstracts Views on Vision4Press platform.
Data correspond to usage on the plateform after 2015. The current usage metrics is available 48-96 hours after online publication and is updated daily on week days.
Initial download of the metrics may take a while.