Fig. 2
Download original image
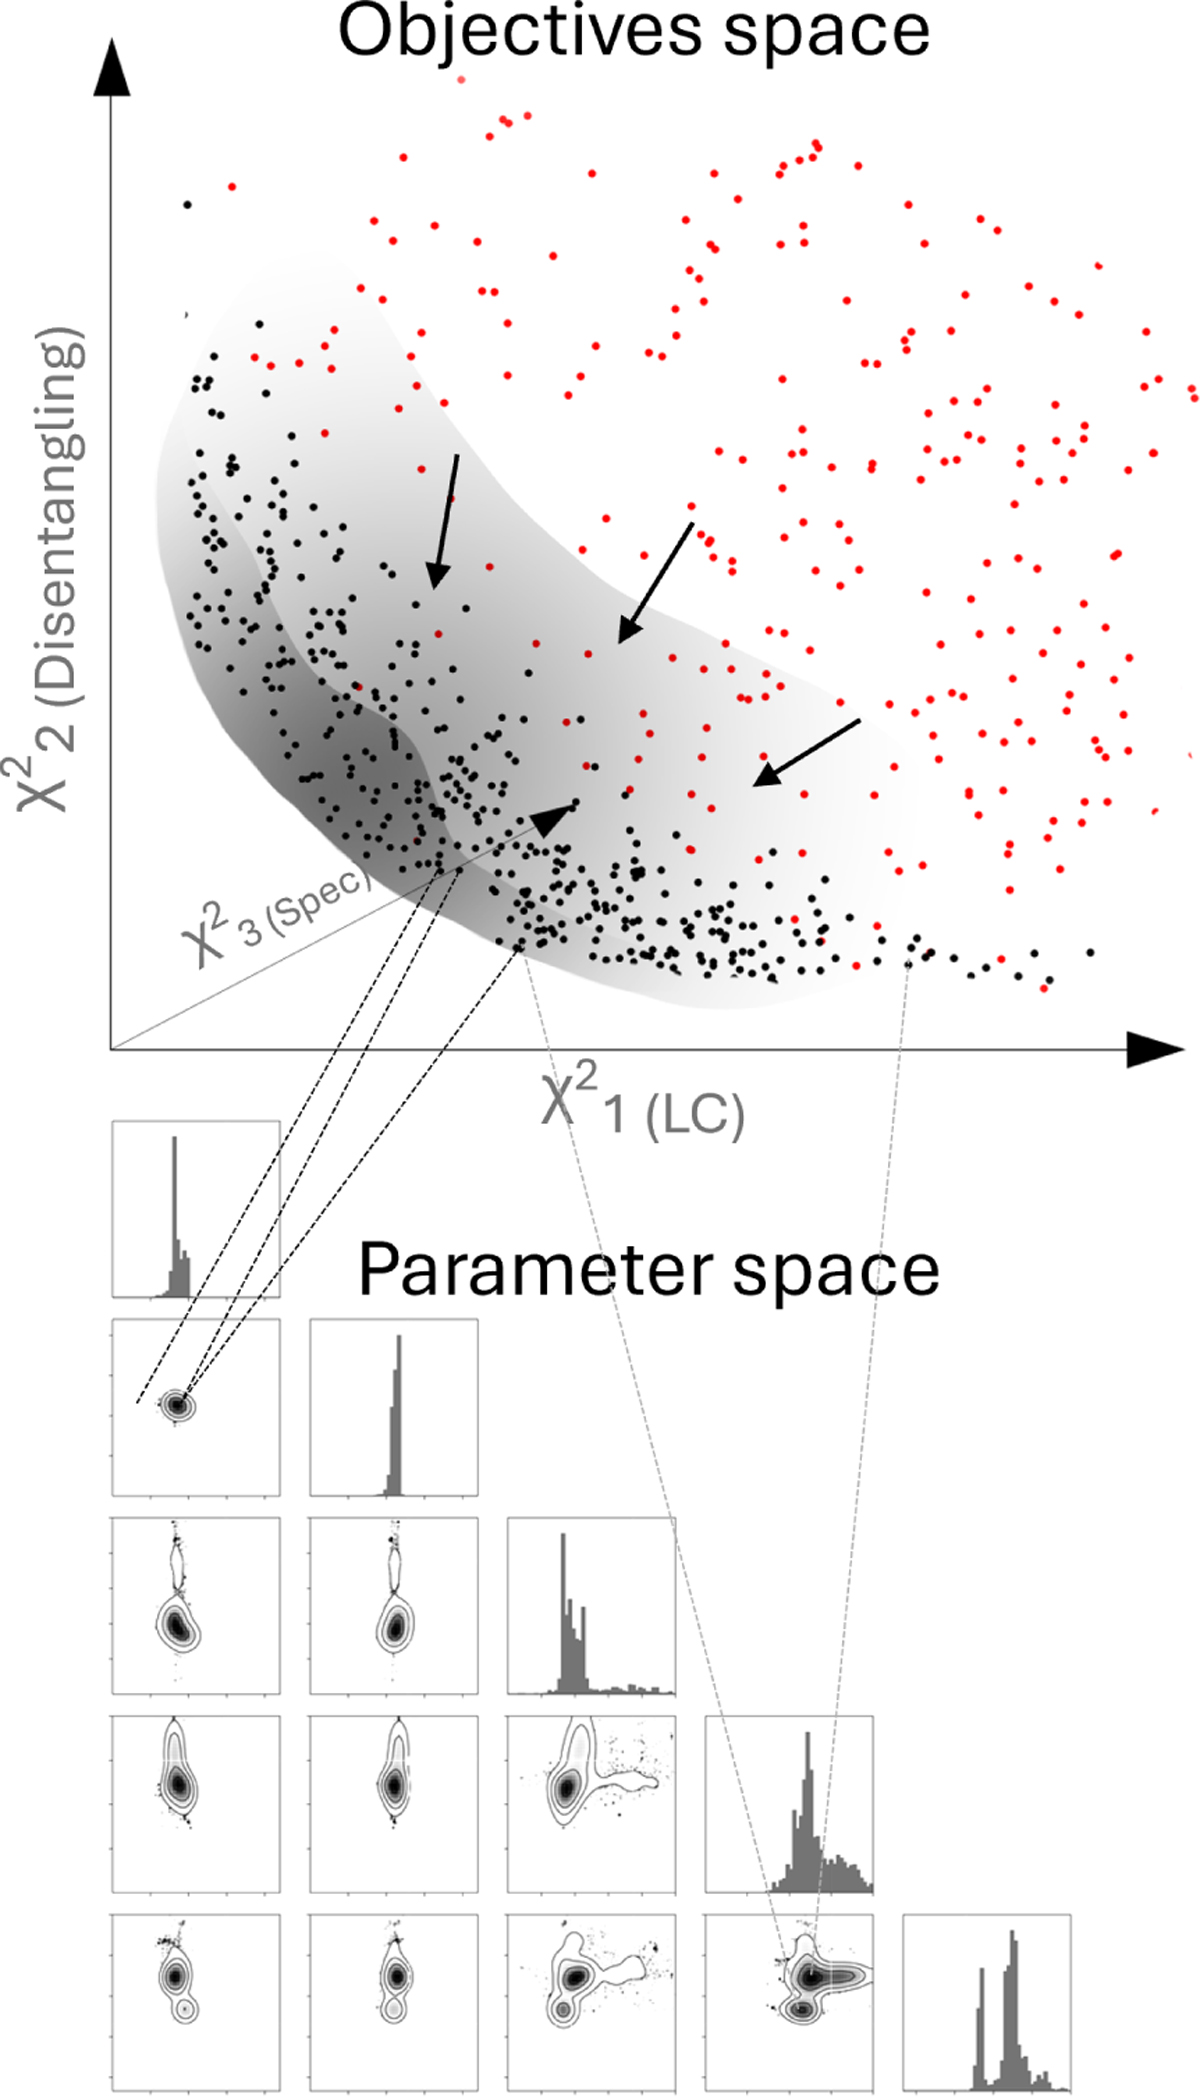
Upper panel: visual representation of a cloud of solutions (sets of parameters) in 3D space of objective functions, advancing from initial population state (red) towards approaching the trade-off surface (black). Lower panel: representation in the parameter space via pairwise corner plot. Solutions that are close in the objective space (i.e. have similar χ2 values) do not have to appear close in the parameter space, while those close in the full parameter space should appear close in the objectives space if the parametrisation is continuous.
Current usage metrics show cumulative count of Article Views (full-text article views including HTML views, PDF and ePub downloads, according to the available data) and Abstracts Views on Vision4Press platform.
Data correspond to usage on the plateform after 2015. The current usage metrics is available 48-96 hours after online publication and is updated daily on week days.
Initial download of the metrics may take a while.