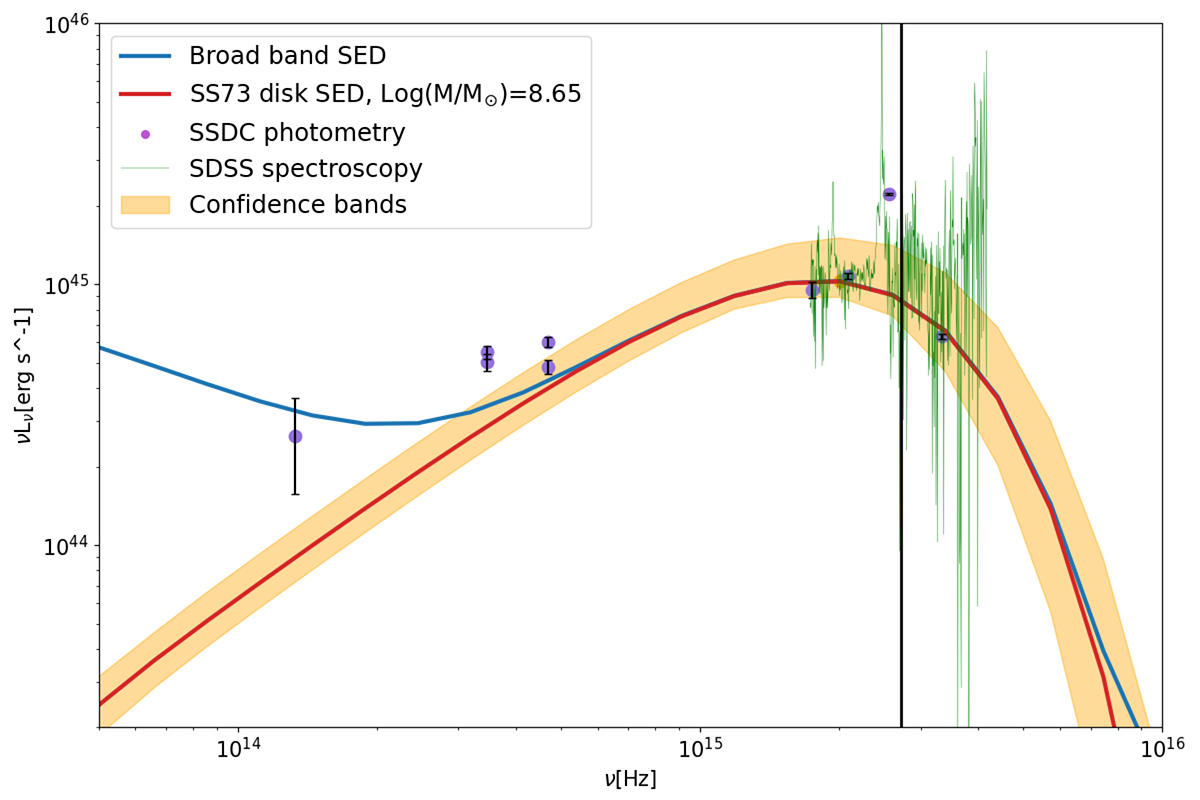
Fig. 2.
Download original image
Zoomed-in visual of the most reliable model for 1508+5714, focused on the accretion disk emission. As in Fig. 1, photometric and spectroscopic data are indicated by purple points and a green line, respectively, while the red solid line indicates the SS73 model obtained with a mass of 4 × 10⁸ M⊙ and an accretion rate of about 2%. The vertical black line highlights the Lyα line frequency, above which we suspect that the Meiksin (2006) algorithm over-corrects the intervening absorption. Therefore, we exclude that section of the spectrum in our modeling.
Current usage metrics show cumulative count of Article Views (full-text article views including HTML views, PDF and ePub downloads, according to the available data) and Abstracts Views on Vision4Press platform.
Data correspond to usage on the plateform after 2015. The current usage metrics is available 48-96 hours after online publication and is updated daily on week days.
Initial download of the metrics may take a while.