| Issue |
A&A
Volume 663, July 2022
|
|
|---|---|---|
| Article Number | A147 | |
| Number of page(s) | 10 | |
| Section | Extragalactic astronomy | |
| DOI | https://doi.org/10.1051/0004-6361/202243569 | |
| Published online | 22 July 2022 | |
Blazar nature of high-z radio-loud quasars
1
INAF – Osservatorio Astronomico di Brera, Via Emilio Bianchi 46, 23807 Merate, Italy
e-mail: This email address is being protected from spambots. You need JavaScript enabled to view it.
2
ASI – Agenzia Spaziale Italiana, Via del Politecnico snc, 00133 Roma, Italy
Received:
16
March
2022
Accepted:
18
May
2022
Abstract
We report on the Swift/XRT observation and classification of eleven blazar candidates at z > 4. These sources were selected as part of a sample of extremely radio-loud quasars, with a focus on quasars with jets oriented roughly close to our line of sight. Deriving their viewing angles and their jets’ bulk Lorentz factors was crucial for a strict blazar classification, which was made possible only thanks to X-ray observations. Out of eleven sources, five show strong and hard X-ray fluxes that set the foundation for their blazar classification, while two are uncertain and three host relativistic jets that we observe just outside their beaming cone (i.e. are not strictly blazars), while one went undetected by Swift/XRT. Following this approach, we were able to trace the > 109 M⊙ active super-massive black hole (SMBH) population hosted in jetted active galactic nuclei (AGN). At z ≥ 4, the massive jetted sources are likely predominant in the overall quasar population: this calls for a deep review of our understanding of the first SMBH formations and evolution. Jets are indeed key actors in fast accretion and must be searched for across the whole high-redshift quasar population. A note of caution must be added: radio-loudness and, in general, radio features at high redshifts seem do not seem to perfectly reflect high-energy properties. A strong effect attributed to the interaction with cosmic microwave background (CMB) radiation is surely at work, which quenches the radio emission with respect to the X-rays; however, in addition, more frequent occasions for the jet to be bent seem to play a relevant role in this regard. Thus, classifications and population studies must be carefully performed, so as to avoid interference resulting from these inconsistencies.
Key words: galaxies: jets / quasars: general / galaxies: active / X-rays: general
© T. Sbarrato et al. 2022
 Open Access article, published by EDP Sciences, under the terms of the Creative Commons Attribution License (https://creativecommons.org/licenses/by/4.0), which permits unrestricted use, distribution, and reproduction in any medium, provided the original work is properly cited.
This article is published in open access under the Subscribe-to-Open model. This email address is being protected from spambots. You need JavaScript enabled to view it. to support open access publication.
1. Introduction
The active super-massive black hole (SMBH) census is becoming increasingly populated. At extreme redshifts (z > 5.7), there are ∼300 quasars that are currently known (Fan et al. 1999; Bañados et al. 2016; Jiang et al. 2016), while a few dozen radio-loud active galactic nuclei (AGN) are known at z > 4.5, with only few at redshifts greater than 6, being much rarer than their radio-quiet or radio-silent counterparts. The fraction of radio-loud sources among the total high-z quasar population is currently consistent with the local Universe (Bañados et al. 2015), namely, ∼10% of known quasars have a radio flux that is more than ten times brighter than its emission in the blue band. Radio loudness is generally associated with the presence of strong relativistic jets, since extended lobes or a relativistically beamed structure are solely responsible for such strong radio emissions.
This distant active SMBH population is currently mainly composed by extremely massive, highly accreting objects. All known high-redshift quasars have black hole masses of M > 3 × 10⁸ M⊙ and accretion rates of > 10% of the Eddington limit, with the large majority more massive than 109 M⊙ and around 30%LEdd. This is clearly an observing bias, but the presence of these sources have raised many issues on the formation and evolution of the first SMBHs. Volonteri (2012) and Inayoshi et al. (2020) reviewed the possible mechanisms to build up M > 109 M⊙ in a short amount of time (< 1 Gyr). In order to assemble such massive black holes, a M > 104 M⊙ black hole seed is necessary if the accretion occurs in an Eddington-limited regime. The formation of this kind of seed is not straightforward: the collapse of a massive gas cloud might be prevented by fragmentation due to cooling and star formation activity. Clearly, the accretion might be faster if super-Eddington phases are encountered during the evolution of the SMBH, introducing the known difficulties of sustaining a continuous super-critical regime. Nevertheless, a super-Eddington accretion or phases would allow a smaller black hole seed, avoiding the issue of fragmentation during its formation. Relativistic jets have been proposed as important tools to allow the fast accretion of early quasars (Jolley & Kuncic 2008; Ghisellini et al. 2013; Regan et al. 2019) and, in fact, their distribution in the early Universe is crucial in understanding their link to the formation of the first SMBHs.
Tracing the presence of jetted sources at z > 4 is not an easy task: the radio surveys start reaching their sensitivity limit in detecting distant sources. The effect of beaming on emitted radiation becomes thus crucial in order to make jets visible at high redshift. Blazars thus have a peculiar advantage in terms of their selection and observation. Jetted AGN are classified as blazars when their jets are aligned to our line-of-sight, allowing for their jets to dominate the overall emission across the whole electromagnetic spectrum. Their spectral energy distribution (SED) is characterized by two broad humps, produced by synchrotron and inverse Compton (IC) emission (at low and high frequency, respectively). The synchrotron radiation is visible down to the MHz–GHz frequency range, while IC normally reaches γ-ray energy range, and in some cases, up to the TeV domain. The latter is normally the smoking gun of blazars emission: synchrotron is in fact responsible for strong radio emission in misaligned jetted AGN as well, even when it is less intense or has different spectral shapes. For this reason, in the local Universe and up to z ∼ 3 − 3.5 blazars are easily detected and classified thanks to all-sky high-energy facilities, such as Fermi/LAT. Because of its sensitivity limit and the redshift of the high-energy component at z > 3.5, at such distances, blazars are not systematically detectable – thus, a more focussed approach is thus needed. The solution lies in pointed X-ray observations: instead of performing an all-sky unbiased search, a sample of blazar candidates must be collected in order to study the first section of their IC emission, if present. We selected reliable candidates on the basis of their optical features and strong radio brightness (see Sect. 2).
In the following, we present X-ray observations of eleven sources from Sbarrato et al. (2013a) and their broad-band SED modelling. The sample selection and data collection and analysis are shown in Sect. 2. Section 3 details the model we used to interpret the broad-band spectral energy distribution (SED) and derive the key physical parameters of our sample. In Sect. 5, we discuss how radio and X-ray features in a few cases point towards different conclusions on jet inclination angle. Section 6 presents the implications on the number density of jetted quasars given by our findings and how it impacts our knowledge of early formation and evolution of SMBHs. Finally, Sect. 7 summarizes our work and findings. In this work, we adopt a flat cosmology with H0 = 70 km s−1 Mpc−1 and ΩM = 0.3.
2. Sample selection and data analysis
In Sbarrato et al. (2013a) we selected a sample of 19 spectroscopic blazar candidates, together with other 12 outside of the SDSS+FIRST spectroscopic footprint. We followed up the first 4 of them with X-ray observations, and managed to classify them as blazars in Sbarrato et al. (2015). We then obtained Swift/XRT observations for other 11 sources, which are presented in this work.
The sample selection criteria are based on optical and radio features. We started from the quasar catalog of the Sloan Digital Sky Survey (SDSS, York et al. 2000) Seventh Data Release (DR7, Schneider et al. 2010), selecting the highest redshift and most radio-loud sources. We focus on z > 4 sources, and we only consider those with a radio loudness of R = F5 GHz/F4400 Å > 100 (rest frame fluxes, Kellermann et al. 1989). Powerful jets are generally associated with radio-loud AGN (R > 10). When the jet is aligned close to our line-of-sight, the relativistic beaming is responsible for an overboosting of the radio emission, leading to extreme R values. Selecting R > 100 allows us to focus only on the most likely aligned sources. This selection has proven itself effective: the most radio bright sources out of the original sample were confirmed to be blazars with accretion features consistent with flat-spectrum radio quasars, namely, fast accretors with strong emission lines and redder and brighter broad-band SEDs (Sbarrato et al. 2012, 2013b, 2015). We thus continued the identification process by observing the next probable blazar candidates within our sample.
Swift/XRT observations and data. The analysis of the data from the X-Ray Telescope (XRT; Burrows et al. 2005) on board the Swift satellite was done by using HEASOFT v 6.29 and the CALDB updated on 2022 January 1 and by following standard procedures as described, for instance, in Sbarrato et al. (2015). Because of the low amount of statistics, the X-ray data were analysed by using an unbinned likelihood (Cash 1979).
One of the blazar candidates selected for this work (SDSS J030437.21+004653.5, z = 4.305) is undetected by Swift/XRT after 24.4 ks of observations. We report in Table 1 the 3σ upper limit in the 0.3 − 10 keV flux. All other sources are well detected, with intense fluxes and more or less hard spectra. All results are reported in Table 1 and discussed in the following.
Data analysis details.
3. The model
We modelled the broad-band SEDs of our candidates, including new X-ray observations, in order to interpret their nuclear and jet emission. This model makes it possible to classify them as blazars (or not) and this allows us to estimate the beaming factors and black hole masses and to thus study the early jetted quasar population.
3.1. Black hole mass and accretion luminosity
Our blazars are very luminous, not only due to their beamed jet flux, but also due to their prominent accretion disk emission. Furthermore, the large redshift let us see the high frequency part of the jet emission, close to its peak. Finally, the status of a blazar candidate ensures that we are observing the jet at a small viewing angle, which implies (most likely) that the disk is viewed face-on.
This means that we can use an accretion disk model to find out the two parameters of interest: the black hole mass M and the bolometric accretion luminosity Ld, in a reliable way. For simplicity, we used the standard Shakura & Sunyaev (1973) disk model, assuming an efficiency, η (defined by Ld = ηṀc2), fixed to the value of η = 0.083. For a given Ṁ (i.e. for a given Ld), the black hole mass regulates the peak frequency of the disk emission (heavier black holes have larger Schwarzschild radii and, thus, colder disks). Consider also that at the peak of the disk emission, νLν ∼ Ld/2 (see also Calderone et al. 2013). If the peak of the disk spectrum is visible (as in the case of this sample), the uncertainties are on average less than a factor of 2 better than the virial method. We note that this approach to deriving black hole masses is particularly rewarding, given that at z > 4 the virial method is mainly based on the CIV emission line, which introduces even larger uncertainties than the standard factor of 3–4 because of the asymmetric profile that shows up frequently.
For the accretion disk luminosity, our sources show no sign of any contribution of the jet emission in the optical/UV, making the estimate of Ld reliable. We note that with respect to the parameter Lbol used, for instance, by Shen et al. (2011), there is a factor of 2 difference (i.e., Lbol ∼ 2Ld) because Lbol includes the X-ray corona emission and the IR flux from the molecular torus.
We checked a posteriori that Ld is always below 0.3LEdd (with one exception) and above 10−2LEdd, which is consistent with the application of a Shakura–Sunyaev disk model.
3.2. The jet model
We used the one-zone leptonic model by Ghisellini & Tavecchio (2009). The original paper presents a full discussion of the features of the model. Here, we focus on defining the model parameters. We note that the black hole mass, M, and the accretion luminosity, Ld, are derived as discussed above.
(i) We assume that there is one region within the jet where most of the luminosity is produced at a distance Rdiss from the black hole. We assume that the jet is conical with fixed semi-aperture angle ψ = 0.1. Thus, the size of the emitting (assumed spherical) region is R = ψRdiss.
(ii) The emitting region is magnetized with a tangled but homogeneous magnetic field, B.
(iii) The emitting plasma moves with a velocity, βc, corresponding to a bulk Lorenz factor, Γ, at an angle, θv, from our line of sight.
(iv) Throughout the region, relativistic electrons are injected, with a power,  , as measured in the comoving frame. The injected distribution, assumed to be constant and homogeneous throughout the source, is:
 (1)
(1)
where s1, s2, γmin, γb, and γmax are the slopes of the injected distribution of electrons (smoothly joining broken power law) and minimum, break, and maximum random Lorentz factors. The normalization, Q0, is set via:
 (2)
(2)
where γmin is set equal to one, while γmax, for s2 > 2, is unimportant. The slopes s1 and s2 are associated (by means of the continuity equation) to the observed slopes before and after the two broad peaks of the SED. The particle distribution is calculated at the dynamical time, R/c. This allows us to neglect adiabatic losses and allows us to use a constant (in time) magnetic field and volume.
(v) At a distance RBLR, there is the broad line region (BLR). We assume that it is scaled as:
 (3)
(3)
where Ld, 45 is the disk luminosity in units of 1045 erg cm−2 s−1
(vi) The molecular torus intercepts a fraction f of Ld and re-emits it in the infrared. Its location is assumed to be:
 (4)
(4)
(vii) We assume that the X-ray corona emits a luminosity, Lxc, in the form of a power law of energy index, αX ∼ 1, ending in an exponential cut at hνc ∼ 150 keV. Typically, here we use Lxc(ν)∝ν−1exp(−hν/150 keV).
Of these parameters, ψ, θv, Lxc, αX, hνc, and γmin are kept fixed (with rare exceptions). The exact value of γmax is unimportant (for s2 > 2); Ld is found through direct fitting or through the broad line luminosities, fixing RBLR, Ltorus, Rtorus, and νext. The black hole mass, M, is found through the disk fitting method (when possible), or from the virial method.
We are left with seven relevant free parameters: Rdiss (or equivalently, R), B, Γ,  , s1, s2, and γb. The observables used to constrain these parameters are:
(i) the synchrotron and the inverse Compton luminosity (LS, LC);
(ii) the synchrotron and the inverse Compton frequency peaks (νS, νC);
(iii) the spectral indices pre and post peak (α0, α1, which can be different for the synchrotron and IC peak, according to the relative importance of the SSC process or the importance of Klein–Nishina effects);
(iv) the minimum variability timescales (tvar) when known.
The one-zone model we are using never allows for an accounting of the radio emission, which is due to a superposition of different emitting region at larger distances.
One relevant quantity that the model can return is the jet power, as the sum of the power radiated and carried in the form of magnetic field, relativistic electrons, and protons (assumed to be cold). All of these forms of powers can be expressed as:
 (5)
(5)
where  is the energy density of the i-component.
4. Results
Our main aim is to confirm the blazar nature of our candidates (or otherwise, of course). We are guided by SED modelling, which is, in turn, influenced by the shape and luminosity of the X-ray spectrum. Furthermore, we are interested in blazars whose black hole mass is larger than 109 M⊙, to find out the total number density of BHs of a high mass in radio-loud sources.
The left panel of Fig. 1 shows a typical example of a confirmed blazar. The X-ray flux is intense and hard, driving the derivation of a small viewing angle (θv = 3°), which, combined with a Lorentz factor of Γ = 13, points toward a secure blazar classification. Even the strict definition that we follow is valid, as in this case: the viewing angle is in fact smaller than the beaming angle (θv ≤ 1/Γ). We also derived a black hole mass of 4 × 10⁹ M⊙ and Ld = 7% of the Eddington limit by studying the thermal emission from the accretion disk.
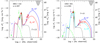 |
Fig. 1. Broad-band observed SEDs for sources SDSS J085111.59+142337.7 (left) and SDSS J105320.42–001649.7 (right), as examples of sources classified as a blazar and a non blazar, respectively. In all panels, the thin solid lines are SDSS spectra, purple points, and upper limits are from allWISE, the red filled points are from GROND (Sbarrato et al. 2013b), and green points show archival data (Space Science Data Center). Red empty data points are instead the new X-ray data from this work. The models include a thermal emission from the disk, jet, and corona (dashed black line), a synchrotron component (green lines) and an external Compton component at higher energies. The different models in each panel differ mainly by their viewing angle, which mainly affect the high energy section (different colours, as labelled). The parameters for all the solutions are detailed in Table 2. |
Input parameters used to model the SED.
The right panel of Fig. 1, instead, shows an example of a source whose jet is directed roughly in our direction, but does not fall within the strict definition limits of a blazar. The softer X-ray spectrum is the main one responsible for a larger viewing angle classification. This is due to the large error bars on X-ray data: even if a large Lorentz factor of 13 is reasonable, the viewing angles consistent with multiwavelength data range between 5° and 8°. Nevertheless, SDSS J105320.42–001649.7 is an interesting source, having a high mass and Eddington ratio (M ≃ 1.5 × 10⁹ M⊙ and Ld = 27%LEdd), but it cannot be taken into account in our subsequent discussions.
Notes on single sources The SEDs of all the sources are reported in the appendix, whereas in the following, we review the results and subsequent classification of our sample, excluding the two sources described in the previous section and the one undetected in the X-rays.
SDSS J081333.32+350810.8. The BH mass is 4 × 10⁹ M⊙ with Ld = 12%LEdd. It can be fitted with θv = 5.2°, that is ∼1/Γ, if Γ = 13, but also with θv = 8° (with the same Γ). Therefore, it is likely a source viewed at the edge of our definition of blazar.
SDSS J103717.72+182303.0. The BH mass is 109 M⊙ with Ld = 20% of the Eddington luminosity. The data quality does not allow to definitely classify this source as a blazar, because a range of θv can fit the SED equally well, as long as θ < 8°. Therefore, it is either a blazar or a source viewed at the border of our definition of this class.
SDSS J123142.17+381658.9. The BH mass is M = 7 × 10⁸ M⊙ with Ld = 20%LEdd. We show three different models with the same Γ = 11 but different θv. According to our definition, to be classified as blazar, θv ≤ 1/Γ. Therefore, using Γ = 11, the limiting angle is 5.2 deg. We see that the model with θv = 8° passes below the X-ray data, which are instead well accounted for with smaller θv. We thus classify this source as a blazar, but with a mass below 109 M⊙.
SDSS J123503.03–000331.7. The BH mass is M = 2 × 10⁹ M⊙ with Ld = 7% Eddington. The X-ray spectrum is hard with a large luminosity and is well fit with Γ = 13 and θv = 3°. We classify this source as a blazar.
SDSS J124230.58+542257.3. The BH mass is M = 3.5 × 10⁹ M⊙ with Ld = 8% Eddington. The X-ray spectrum is not well constrained, but data seem to exclude a very hard spectrum, therefore we classify the source as a non-blazar.
SDSS J141209.96+062406.8. The BH mass is M = 6 × 10⁸ M⊙ with Ld = 63% Eddington. We show two different models, one with Γ = 11 and θv = 3° and the other with Γ = 10 and θv = 5°. The limiting θv for Γ = 10 is 5.7°. We conclude that the source is indeed a blazar, but with a mass smaller than 109 M⊙.
SDSS J165913.23+210115.8. The BH mass is M = 2.5 × 10⁹ M⊙ with Ld = 10%LEdd. The X-ray spectrum and luminosity clearly suggest the blazar nature of this source, confirmed by our model, with θv = 3° and Γ = 13.
SDSS J231448.71+020151.1. The BH mass is M = 1.5 × 10⁹ M⊙ with Ld = 15% Eddington. The X-ray spectrum is hard and luminous: the best model prefers θv < 1/Γ, but we note that in this case we find a relatively small value of Γ(=9), so that the limiting angle becomes 6.3°.
5. Double nature of high-z blazar candidates
Cao et al. (2017) have observed four z > 4 blazar candidates with radio interferometry in order to understand the radio jet orientation. Interestingly, two sources that we classified as blazars in Sbarrato et al. (2015), when observed at high resolution, appear as misaligned jetted sources. The X-ray emission clearly shows a strong and hard spectrum, which is a clear signature of a relativistic jet aligned to our line of sight. The radio emission instead shows features of misaligned relativistic jets. This puzzling discrepancy highlights some difficulties involved in interpreting the jet orientation at high redshift. We consider two possibilities for interpreting these observational features.
(i) It is either the case that we are observing blazars whose jets are bent or that have undergone a change in direction, with a high-energy emitting region aligned to our line of sight, differently from the extended radio emission orientation;
(ii) Alternatively, the relativistic jet structure and emitting features are intrinsically different at low and high redshift, leading to different observational signatures.
We cannot, in fact, exclude the possibility that the jets may have different emitting features at high redshift: no wide multiwavelength population studies are possible yet, with a few hundred sources known, of which only a fraction have multi-wavelength jet studies. Up to z ∼ 3 the features of jetted sources do not appear to be drastically different, however. In other words, the jet emission is produced by a region moving along the jet with bulk Lorentz factor in the range of Γ ∼ 10 − 15, with a beaming angle of approximately 1/Γ. If the jet is observed at small viewing angles (or even inside the beaming cone), the AGN broad-band flux will likely be dominated by the jet emission, and (specifically) the X-ray flux will be intense and with a hard spectrum, while the radio emission will be flattened, bright, and compact on VLBI scales. If the viewing angle is larger (e.g., > 10°), the X-ray spectrum will be significantly dimmer and softer, easily going undetected even at smaller redshift, up to the point where the X-ray corona emission will dominate. The sources we classified as blazars both in this work and in Sbarrato et al. (2015) show strong and hard X-ray fluxes, which – together with the broad-band SED modelling – have led us to assume strong beaming and small viewing angles. VLBI observations by Cao et al. (2017), instead, show for some sources larger viewing angles, up to 20°, clearly not consistent with bulk Lorentz factors Γ ∼ 10. We cannot exclude that jets are less extremely relativistic at higher redshift, with smaller bulk Lorentz factors. This would widen the beaming cone of these blazar candidates, allowing the X-ray flux to stay brighter up to much larger viewing angles, but simultaneously losing hardness in the X-ray spectrum. Again, a large viewing angle would not be consistent with the X-ray emission that we observe for these sources.
The other, maybe easier, possibility is that the physical features of AGN jets are still coherent with the low redshift population, but the relativistic jets are bent more easily. AGN with bent jets have already been observed in the local Universe. The bending might be due to changes in the propagation medium densities, or in the jet base orientation, that is, possible changes in the black hole spin orientation or in the black hole-accretion disk relative orientation. If, as we would expect for an extremely fast formation and evolution scenario, the AGN environment is more chaotic than in a lower redshift counterpart, the jet will more likely be bent by one of these conditions. Under this assumption, the X-ray emitting region, closer to the central SMBH, would be aligned to our line of sight. Moving farther away from the nuclear region, instead, the jet might be bent and the radio emission would come from a region that is therefore directed away from our line of sight (at least at larger viewing angles). This geometric configuration would explain why the broad-band SED, with a particular emphasis over the high-energy part, is better described by an aligned relativistic jet, while the high-resolution radio interferometry hints toward a jet that is misaligned up to 20°.
The available data do not allow us to disentangle between these options. More extensive classifications of jetted AGN candidates at z > 4 performed independently with radio and X-ray based methods are paramount, if only to establish the statistics of the inconsistencies. X-ray data are already on the edge of Swift/XRT sensitivity for many of the blazar candidates we are considering: more powerful and upcoming facilities will certainly be helpful in deepening our understanding of the high-energy component.
6. Early evolution of jetted AGN
The large majority of discovered quasars at z > 4 have black holes with masses higher than 109 M⊙. This includes our sources, except for, however, SDSS J123142.17+381658.9 and SDSS J141209.96+062406.8, which have masses of about 7 and 6 × 10⁸ M⊙, respectively1. We note that this is not an instrinsic property of the high-redshift quasar population, but it is an effect of the observing bias that follows the telescopes’ sensitivity limits: we are only observing the most luminous (hence, the most powerful) and likely the more massive of the quasar population. It is evident that what we are mapping is only the tip of the iceberg.
It is nonetheless interesting to investigate the objects in this mass range: following Ghisellini et al. (2010, 2013), Sbarrato et al. (2015), and Sbarrato (2021) we aim at focusing on the distribution of such sources. We extracted the comoving number density of quasars with masses > 109 M⊙ from the luminosity function of quasars built by Shen et al. (2020). Our efforts are aimed at including theoretical luminosity functions, but they usually follow observations, for instance, Yung et al. (2021) reproduces the distribution obtained by Shen et al. (2020) and it would thus not add any information.
Since we do not have black hole mass estimates for the whole sample from Shen et al. (2020), we assume that all sources with a bolometric luminosity larger than the Eddington luminosity for a 109 M⊙ SMBH (i.e., Lopt > 1047 erg s−1 have M > 109 M⊙) indeed host only > 109 M⊙ SMBH. Therefore, we assumed that all sources with Lopt > 1047 erg s−1 have M > 109 M⊙. Clearly we will be missing billion solar masses sources with smaller luminosities (and, hence, with smaller Eddington ratios), but the object density will not be contaminated by black holes with smaller masses. The number density that can be extracted from this sub-sample is thus a lower limit on the total 109 M⊙ population, but not far in luminosity from the quasars currently observed at high redshift. This approach allows us to study the whole quasar population: no distinction between jetted and non-jetted sources is made in the work by Shen et al. (2020).
In order to study the density of only jetted sources, instead, we chose to focus on blazars in order to follow the same approach at all redshifts. Defining blazars only as those jetted AGN with their viewing angles (θv) smaller than their beaming angles (1/Γ), it can be inferred the presence of 2Γ2 analogous sources randomly oriented in the sky. Since typically for these powerful sources Γ ∼ 10 − 15, hundreds of jetted AGN can be inferred by the detection of even few blazars. Thus, instead of considering a general sample of jetted sources, we only focus on blazars: up to z ∼ 3.5, all-sky, high-energy catalogs are available, while at higher redshifts one must consider individually classified sources. For the lower redshift part, we again followed Ghisellini et al. (2010) and used the same Fermi/LAT and Swift/BAT all-sky catalog releases, while the z ≥ 4 part is composed by our systematic classification.
Figure 2 shows the comoving number density of these samples, immediately highlighting that the distribution of jetted and non-jetted MBH > 109 M⊙ quasars are strikingly different. The total population, dominated by the radio-quiet and silent sources, shows a prominent peak at z ∼ 2.5, as expected. On the other hand, jetted sources, as traced by blazars, appear to have a different density distribution across cosmic history (maybe affected by the combination of two different all-sky samples, Sbarrato et al. 2015) and, in particular, a much larger comoving number density at z ∼ 4 than in the closer Universe. This was already evident in previous versions of this analysis, but the striking news with the updated classification is that jetted sources are as numerous as the Lopt > 1047 erg s−1 population2. If these samples were complete, we should conclude that most > 109 M⊙ black holes at z > 4 are hosted in jetted quasars, in spite of their radio loudness. We note that 1010 M⊙z > 5 quasars have already proved to host relativistic jets even when they are radio-quiet or when they completely lack standard jet signatures (Sbarrato et al. 2021). At high redshifts, the same behaviour might extend toward smaller masses (but still above a billion M⊙), even if it is only for a substantial fraction of them.
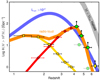 |
Fig. 2. Comoving number density of M ≥ 109 M⊙ SMBHs hosted in jetted (orange line) AGN and in all AGN (blue line). The non-jetted curve is obtained from Shen et al. (2020). The radio-loud sample is instead composed by the Fermi/LAT (yellow squares and line) and Swift/BAT (red circles and line) all-sky catalogs. The bright green hexagons with thick black contours are lower limits to the z > 4 comoving number density of jetted sources derived by known blazars included in the spectroscopic SDSS+FIRST footprint, updated based on the results in this work. The less contrasted hexagons show instead the state of the art earlier than systematic searches of high-z blazars begun. Finally, the yellow diamond is the lower limit obtained by the detection of PSO J0309+27 (Belladitta et al. 2020). The data points obtained by systematic search and classification of blazar candidates are the lower limits, given that the search still ongoing. |
We cannot completely exclude that the issue resides in underestimating non-jetted sources: it has already been observed that high redshift quasars are indeed over-obscured with respect to their “local” counterparts (e.g., Mortlock et al. 2011; Fan et al. 2020). The issue has already been investigated, and it has been suggested that a “dust bubble” (or, more generally, an over-obscuring dusty region) surrounding the accreting nucleus might correct the observed discrepancy between the number of blazars observed and the expected parent population that is currently lacking in radio catalogs (Fabian 1999; Ghisellini & Sbarrato 2016). That hypothesis has suggested that accreting SMBHs (specifically at very high redshift) are surrounded by an excess of obscuring dust that is isotropically distributed. When the accretion luminosity of the nascent quasar reaches a threshold luminosity, its radiation pressure and sublimation power are enough to get rid of the accumulated dust. When instead the luminosity remains below the threshold, the accreting black hole is still obscured; Ghisellini & Sbarrato (2016) suggested that during the over-obscuration phase the jet would be able to pierce through the bubble. In this case, only very aligned jetted sources would be visible in the optical wavelength range. The same mechanism might uniformly apply to non-jetted sources. In that case, quasar luminosity functions would all need a more pronounced correction in order to estimate the absorbed (and thus not observed) quasars. A particularly wild speculation would be needed to estimate whether this might be enough to change the profile of distributions such as the comoving number density of non-jetted sources. Nonetheless, even with the contribution of over-obscuring bubbles, the jetted population would likely be a larger fraction of the overall quasar one, with respect to lower redshift distributions.
Jets and fast mass accretion rates. The high occurrence of relativistic jets in extremely massive quasars at high redshift is compelling and it reopens the question of how jets affect the evolution of early massive black holes. If the most massive black holes actually prefer to form in jetted sources, jets might play a crucial role in their early formation or act as the smoking gun for particularly favourable fast accretion conditions. A simple toy model to interpret the possible jet role in black holes fast accretion has already been explored over the past few years (e.g., Ghisellini et al. 2013; Mazzucchelli et al. 2017; Sbarrato 2021). The core concept relies on the re-distribution of the gravitational energy released during the accretion process. Normally, the accretion disk emission is thought to be produced with a radiative efficiency coincident with the energy release fraction from the accretion structure. If, instead, the relativistic jet launch and acceleration processes exploit part of the gravitational energy release, then not all of that is radiated away, allowing for a faster accretion rate for the same observed luminosity. This would easily speed up the most massive black hole formation, but it is still not clear how this process would work.
Another option might reside in the jet interaction with the environment: what if the jet itself were able to trigger the infall of galactic matter in the vicinity of the black holes? It is already widely known that jet activity influences the host galaxy environment, as it likely serves as a key actor in its evolution. Observational signatures of both positive and negative feedback have been observed in local active galaxies (see e.g., Fabian 2012; Silk & Rees 1998; Harrison et al. 2018; Yuan et al. 2018; Cresci & Maiolino 2018). Thus, the possibility that a relativistic jet is responsible for the infall of matter towards the nucleus, after it has affected star formation activity, is not unlikely. Under this assumption, a jet would be indirectly responsible for fast accretion, but the timing of jet and super-critical accretion phases would also be critical in speeding up this process. Structured extended sources or, at least, signs of jet extension in the nucleus surroundings would be the smoking gun for this hypothesis.
Understanding the mutual influence of accretion and jet, along with the role of the latter in fast black hole evolution are some of the upcoming challenges of AGN physics. Higher resolution studies of the host galaxy morphology and star formation phase, other than that of the extended jet structure itself, will be crucial for understanding the relative age of the relativistic jet and the SMBH. Detailed studies of the regime at which high-z jetted quasars are accreting will also be instrumental, in combination with ionisation studies of the nuclear AGN region. This might help in disentangling the cause-effect conundrum: is the jet responsible for triggering a fast accretion phase, or is the black hole that forces the formation of a relativistic jet by pushing a close to or super critical accretion regime? Upcoming large facilities leading to much deeper optical and IR photometry and spectroscopy (ELT, JWST, VRO) will allow for huge steps to be taken towards improving our understanding of the first massive black holes evolving at the dawn of the Universe.
7. Conclusions
We carried out X-ray observations of eleven extremely radio-loud z > 4 blazar candidates from the SDSS+FIRST survey, along with collecting their archival data and making their classification. After modelling their broad-band SEDs, we were able to classify them as blazars or slightly misaligned jetted AGN in order to include them in our study of the jetted quasar population at z > 4. One source was not detected by Swift/XRT, five were classified as blazars, while two had an uncertain viewing angle and three were observed outside their beaming cone. Two blazars were found to host a black hole with less than a billion solar masses.
Some sources that we previously classified as part of this project were also observed with VLBI, and they are classified differently when their VLBI observations are considered. While high-energy emission points toward small viewing angles, in some cases, high-resolution radio data suggest completely misaligned relativistic jets. We discuss the possibility that the chaotic formation and fast accretion of these systems, as might occur at such high z, might be responsible for the more frequent bending of AGN jets. With our current facilities, we can only expand upon the available statistics in order to assess the occurrence of such discrepancies.
Finally, we focussed on the jetted-to-non-jetted ratio across a wide span of redshifts, finding that at z > 4, jetted sources outnumber the non-jetted ones among > 109 M⊙ active black holes. This proves that jets must have a prominent role in the fast formation of the first SMBH in the Universe. We speculate that jets directly affect the accretion of matter onto the black hole by facilitating the dispersion of gravitational energy released during the accretion process itself, allowing for a faster mass increase at the observed disk luminosity. We cannot exclude the possibility, rather, that it only plays a role in the infall of matter toward the galactic nucleus by affecting star formation on larger scales; however, the sources we are currently studying show both active relativistic jets and fast-accreting central black holes acting simultaneously, thus pointing towards a more intimate link between the two structures.
The uncertainty on the accretion disk emission based masses is of the order of a factor 2, so the sources with < 109 M⊙ might still be consistent with 109 solar mass SMBHs. Nevertheless, we prefer to be conservative and not include them in the following discussion.
This result is extreme since the Lorentz factors of our sources are, as expected, between 10 and 15. For a more stringent consistency with the low redshift jetted-to-non-jetted ratio, smaller Γ values are needed, or not limiting the sample to the largest masses (Diana et al. 2022).
Acknowledgments
We thank the referee for their useful and insightful comments that helped us in improving the paper. We acknowledge financial support from ASI grant I/004/11/5. We made use of data supplied by the UK Swift Science Data Centre at the University of Leicester. Part of this research is based on archival data, software and online services provided by the Space Science Data Center (SSDC), on the NASA/IPAC Extragalactic Database (NED) and of the data products from the Wide-field Infrared Survey Explorer, which are operated by the Jet Propulsion Laboratory, Caltech, funded by the National Aeronautics and Space Administration.
References
- Bañados, E., Venemans, B. P., Morganson, E., et al. 2015, ApJ, 804, 118 [Google Scholar]
- Bañados, E., Venemans, B. P., Decarli, R., et al. 2016, ApJS, 227, 11 [Google Scholar]
- Belladitta, S., Moretti, A., Caccianiga, A., et al. 2020, A&A, 635, L7 [EDP Sciences] [Google Scholar]
- Burrows, D. N., Hill, J. E., Nousek, J. A., et al. 2005, Space Sci. Rev., 120, 165 [Google Scholar]
- Calderone, G., Ghisellini, G., Colpi, M., & Dotti, M. 2013, MNRAS, 431, 210 [NASA ADS] [CrossRef] [Google Scholar]
- Cao, H. M., Frey, S., Gabányi, K. É., et al. 2017, MNRAS, 467, 950 [Google Scholar]
- Cash, W. 1979, ApJ, 228, 939 [Google Scholar]
- Cresci, G., & Maiolino, R. 2018, Nat. Astron., 2, 179 [Google Scholar]
- Diana, A., Caccianiga, A., Moretti, A., et al. 2022, MNRAS, 511, 5436 [NASA ADS] [CrossRef] [Google Scholar]
- Fabian, A. C. 1999, MNRAS, 308, L39 [NASA ADS] [CrossRef] [Google Scholar]
- Fabian, A. C. 2012, ARA&A, 50, 455 [Google Scholar]
- Fan, L., Chen, W., An, T., et al. 2020, ApJ, 905, L32 [NASA ADS] [CrossRef] [Google Scholar]
- Fan, X., Strauss, M. A., Schneider, D. P., et al. 1999, AJ, 118, 1 [NASA ADS] [CrossRef] [Google Scholar]
- Ghisellini, G., & Sbarrato, T. 2016, MNRAS, 461, L21 [NASA ADS] [CrossRef] [Google Scholar]
- Ghisellini, G., & Tavecchio, F. 2009, MNRAS, 397, 985 [Google Scholar]
- Ghisellini, G., Della Ceca, R., Volonteri, M., et al. 2010, MNRAS, 405, 387 [NASA ADS] [Google Scholar]
- Ghisellini, G., Haardt, F., Della Ceca, R., Volonteri, M., & Sbarrato, T. 2013, MNRAS, 432, 2818 [NASA ADS] [CrossRef] [Google Scholar]
- Harrison, C. M., Costa, T., Tadhunter, C. N., et al. 2018, Nat. Astron., 2, 198 [Google Scholar]
- Inayoshi, K., Visbal, E., & Haiman, Z. 2020, ARA&A, 58, 27 [NASA ADS] [CrossRef] [Google Scholar]
- Jiang, L., McGreer, I. D., Fan, X., et al. 2016, ApJ, 833, 222 [Google Scholar]
- Jolley, E. J. D., & Kuncic, Z. 2008, MNRAS, 386, 989 [NASA ADS] [CrossRef] [Google Scholar]
- Kellermann, K. I., Sramek, R., Schmidt, M., Shaffer, D. B., & Green, R. 1989, Aj, 98, 1195 [NASA ADS] [CrossRef] [Google Scholar]
- Mazzucchelli, C., Bañados, E., Venemans, B. P., et al. 2017, ApJ, 849, 91 [Google Scholar]
- Mortlock, D. J., Warren, S. J., Venemans, B. P., et al. 2011, Nature, 474, 616 [Google Scholar]
- Regan, J. A., Downes, T. P., Volonteri, M., et al. 2019, MNRAS, 486, 3892 [CrossRef] [Google Scholar]
- Sbarrato, T. 2021, Galaxies, 9, 23 [NASA ADS] [CrossRef] [Google Scholar]
- Sbarrato, T., Ghisellini, G., Nardini, M., et al. 2012, MNRAS, 426, L91 [Google Scholar]
- Sbarrato, T., Ghisellini, G., Nardini, M., et al. 2013a, MNRAS, 433, 2182 [NASA ADS] [CrossRef] [Google Scholar]
- Sbarrato, T., Tagliaferri, G., Ghisellini, G., et al. 2013b, ApJ, 777, 147 [Google Scholar]
- Sbarrato, T., Ghisellini, G., Tagliaferri, G., et al. 2015, MNRAS, 446, 2483 [NASA ADS] [CrossRef] [Google Scholar]
- Sbarrato, T., Ghisellini, G., Giovannini, G., & Giroletti, M. 2021, A&A, 655, A95 [NASA ADS] [CrossRef] [EDP Sciences] [Google Scholar]
- Schneider, D. P., Richards, G. T., Hall, P. B., et al. 2010, AJ, 139, 2360 [Google Scholar]
- Shakura, N. I., & Sunyaev, R. A. 1973, A&A, 500, 33 [NASA ADS] [Google Scholar]
- Shen, Y., Richards, G. T., Strauss, M. A., et al. 2011, ApJS, 194, 45 [Google Scholar]
- Shen, X., Hopkins, P. F., Faucher-Giguère, C.-A., et al. 2020, MNRAS, 495, 3252 [Google Scholar]
- Silk, J., & Rees, M. J. 1998, A&A, 331, L1 [NASA ADS] [Google Scholar]
- Volonteri, M. 2012, Science, 337, 544 [NASA ADS] [CrossRef] [Google Scholar]
- York, D. G., Adelman, J., Anderson, J. E., Jr, et al. 2000, AJ, 120, 1579 [Google Scholar]
- Yuan, F., Yoon, D., Li, Y.-P., et al. 2018, ApJ, 857, 121 [Google Scholar]
- Yung, L. Y. A., Somerville, R. S., Finkelstein, S. L., et al. 2021, MNRAS, 508, 2706 [NASA ADS] [CrossRef] [Google Scholar]
Appendix A: Broad–band SEDs
We collect in this section all broad–band SEDs of the sources from our sample that have been detected by Swift/XRT, thus excluding SDSS J030437.21+004653.5. All figures show the crucial parameters that are useful for classifying them as blazars (or not), i.e. viewing angle and Lorentz factor.
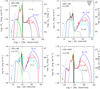 |
Fig. A.1. Broad-band observed SEDs of the candidates SDSS J081333.32+350810.8, SDSS J103717.72+182303.0, SDSS J123142.17+381658.9 and SDSS J123503.03–000331.7, as labelled in shortened versions. Color, points, and line coding as in Figure 1. |
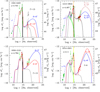 |
Fig. A.2. Broad-band observed SEDs of the blazar candidates SDSS J124230.58+542257.3, SDSS J141209.96+062406.8, SDSS J165913.23+210115.8, and SDSS J231448.71+020151.1. Color coding is the same as in Figure 1 |
All Tables
All Figures
|
Fig. 1. Broad-band observed SEDs for sources SDSS J085111.59+142337.7 (left) and SDSS J105320.42–001649.7 (right), as examples of sources classified as a blazar and a non blazar, respectively. In all panels, the thin solid lines are SDSS spectra, purple points, and upper limits are from allWISE, the red filled points are from GROND (Sbarrato et al. 2013b), and green points show archival data (Space Science Data Center). Red empty data points are instead the new X-ray data from this work. The models include a thermal emission from the disk, jet, and corona (dashed black line), a synchrotron component (green lines) and an external Compton component at higher energies. The different models in each panel differ mainly by their viewing angle, which mainly affect the high energy section (different colours, as labelled). The parameters for all the solutions are detailed in Table 2. |
| In the text | |
|
Fig. 2. Comoving number density of M ≥ 109 M⊙ SMBHs hosted in jetted (orange line) AGN and in all AGN (blue line). The non-jetted curve is obtained from Shen et al. (2020). The radio-loud sample is instead composed by the Fermi/LAT (yellow squares and line) and Swift/BAT (red circles and line) all-sky catalogs. The bright green hexagons with thick black contours are lower limits to the z > 4 comoving number density of jetted sources derived by known blazars included in the spectroscopic SDSS+FIRST footprint, updated based on the results in this work. The less contrasted hexagons show instead the state of the art earlier than systematic searches of high-z blazars begun. Finally, the yellow diamond is the lower limit obtained by the detection of PSO J0309+27 (Belladitta et al. 2020). The data points obtained by systematic search and classification of blazar candidates are the lower limits, given that the search still ongoing. |
| In the text | |
|
Fig. A.1. Broad-band observed SEDs of the candidates SDSS J081333.32+350810.8, SDSS J103717.72+182303.0, SDSS J123142.17+381658.9 and SDSS J123503.03–000331.7, as labelled in shortened versions. Color, points, and line coding as in Figure 1. |
| In the text | |
|
Fig. A.2. Broad-band observed SEDs of the blazar candidates SDSS J124230.58+542257.3, SDSS J141209.96+062406.8, SDSS J165913.23+210115.8, and SDSS J231448.71+020151.1. Color coding is the same as in Figure 1 |
| In the text | |
Current usage metrics show cumulative count of Article Views (full-text article views including HTML views, PDF and ePub downloads, according to the available data) and Abstracts Views on Vision4Press platform.
Data correspond to usage on the plateform after 2015. The current usage metrics is available 48-96 hours after online publication and is updated daily on week days.
Initial download of the metrics may take a while.