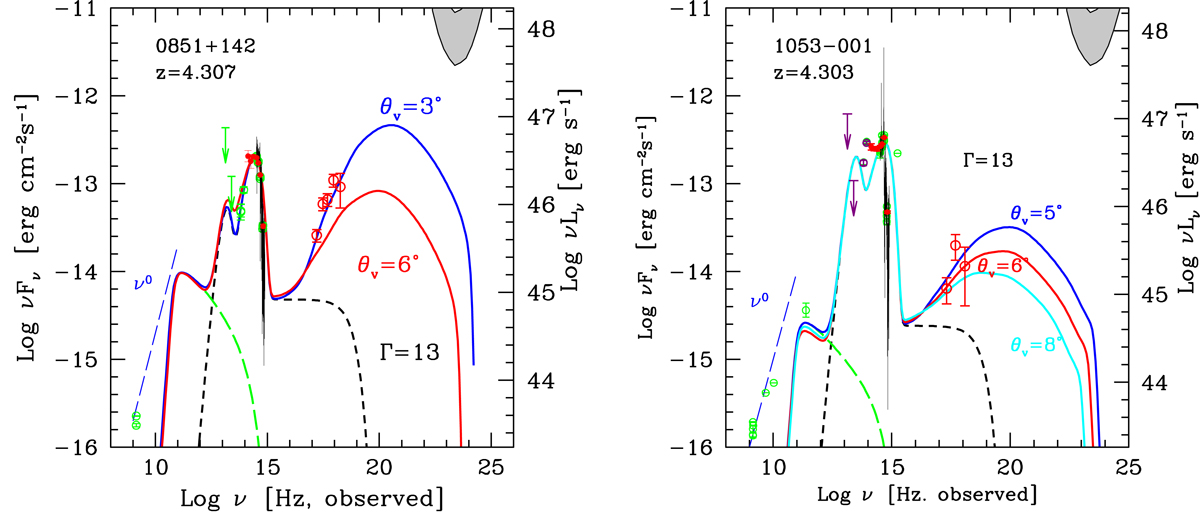
Fig. 1.
Download original image
Broad-band observed SEDs for sources SDSS J085111.59+142337.7 (left) and SDSS J105320.42–001649.7 (right), as examples of sources classified as a blazar and a non blazar, respectively. In all panels, the thin solid lines are SDSS spectra, purple points, and upper limits are from allWISE, the red filled points are from GROND (Sbarrato et al. 2013b), and green points show archival data (Space Science Data Center). Red empty data points are instead the new X-ray data from this work. The models include a thermal emission from the disk, jet, and corona (dashed black line), a synchrotron component (green lines) and an external Compton component at higher energies. The different models in each panel differ mainly by their viewing angle, which mainly affect the high energy section (different colours, as labelled). The parameters for all the solutions are detailed in Table 2.
Current usage metrics show cumulative count of Article Views (full-text article views including HTML views, PDF and ePub downloads, according to the available data) and Abstracts Views on Vision4Press platform.
Data correspond to usage on the plateform after 2015. The current usage metrics is available 48-96 hours after online publication and is updated daily on week days.
Initial download of the metrics may take a while.