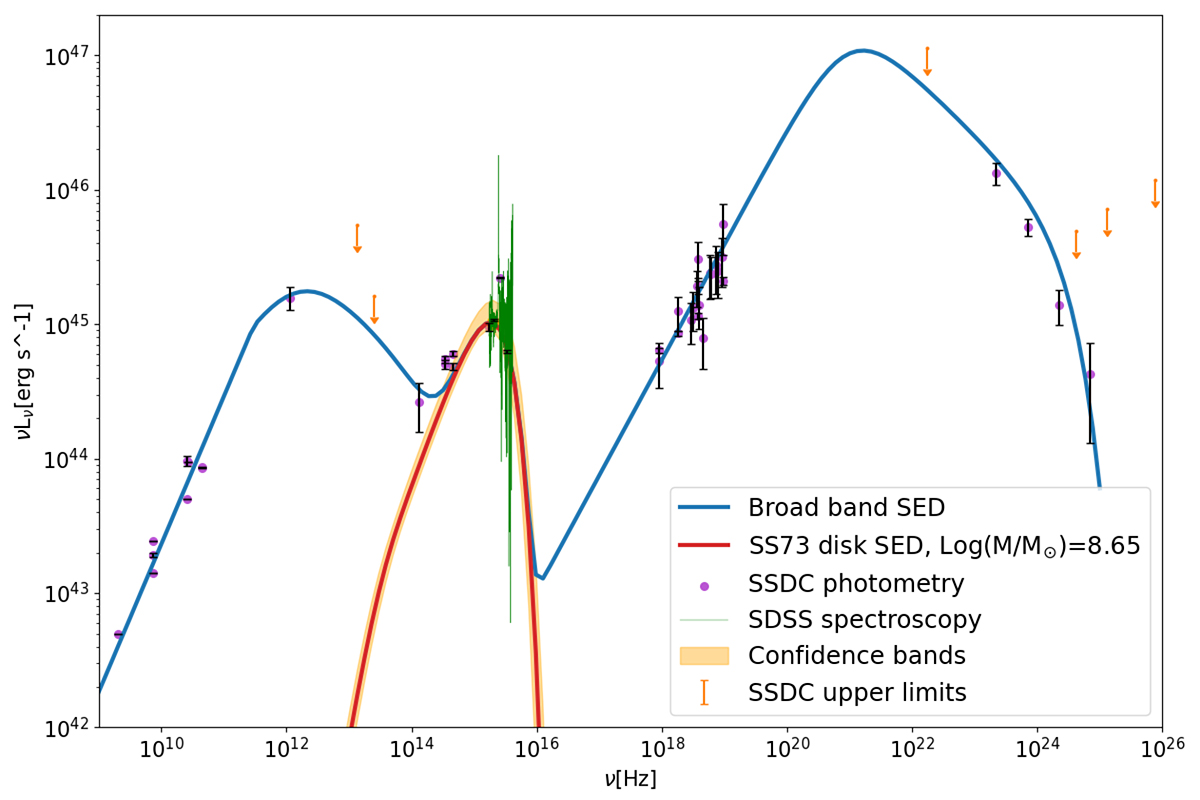
Fig. 1.
Download original image
Broadband SED of 1508+5714. The blue line indicates the total SED that best model the data. The SED includes the jet component (dominated by the two prominent humps in radio and at high-energies) and the accretion disk emission, shown with a red line and yellow band to show its confidence range. Photometric data are shown with purple dots and orange upper limits, while the green line shows the SDSS spectroscopic data. The dataset and related best modeled SED clearly show the typical behavior of a high-z blazar, with a flat radio spectrum, strong Compton dominance, and prominent big blue bump.
Current usage metrics show cumulative count of Article Views (full-text article views including HTML views, PDF and ePub downloads, according to the available data) and Abstracts Views on Vision4Press platform.
Data correspond to usage on the plateform after 2015. The current usage metrics is available 48-96 hours after online publication and is updated daily on week days.
Initial download of the metrics may take a while.