Fig. 7
Download original image
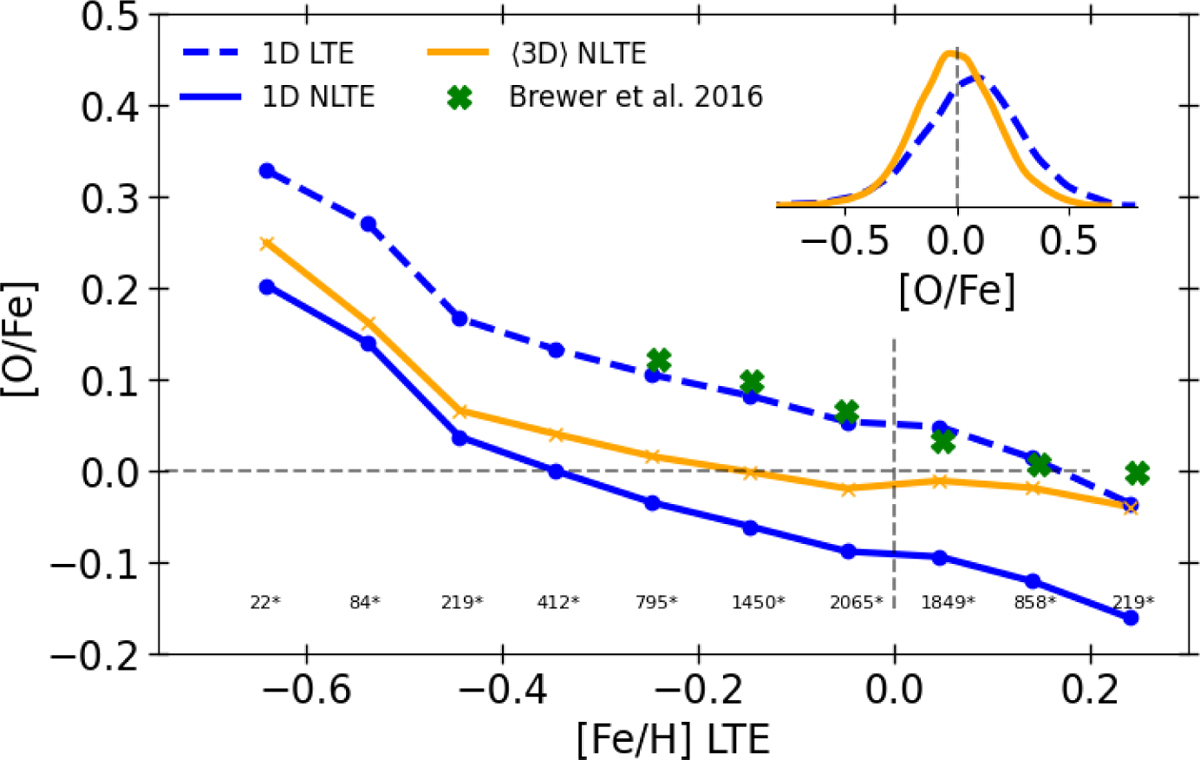
Average [O/Fe] abundances as a function of LTE [Fe/H] for 8018 RAVE stars. The blue dots show 1D-LTE abundances (dashed blue line) and 1D-NLTE abundances (solid blue line). The orange crosses show ⟨3D⟩ LTE abundances (dashed orange line) and ⟨3D⟩ NLTE (solid orange line). We also show a kernel density distribution of the 1D-LTE and ⟨3D⟩-NLTE [O/Fe] abundances in the top-right corner. An average trend computed using the 1D-LTE data for stars in the solar neighbourhood from Brewer et al. (2016) is shown in green crosses.
Current usage metrics show cumulative count of Article Views (full-text article views including HTML views, PDF and ePub downloads, according to the available data) and Abstracts Views on Vision4Press platform.
Data correspond to usage on the plateform after 2015. The current usage metrics is available 48-96 hours after online publication and is updated daily on week days.
Initial download of the metrics may take a while.