Fig. 9.
Download original image
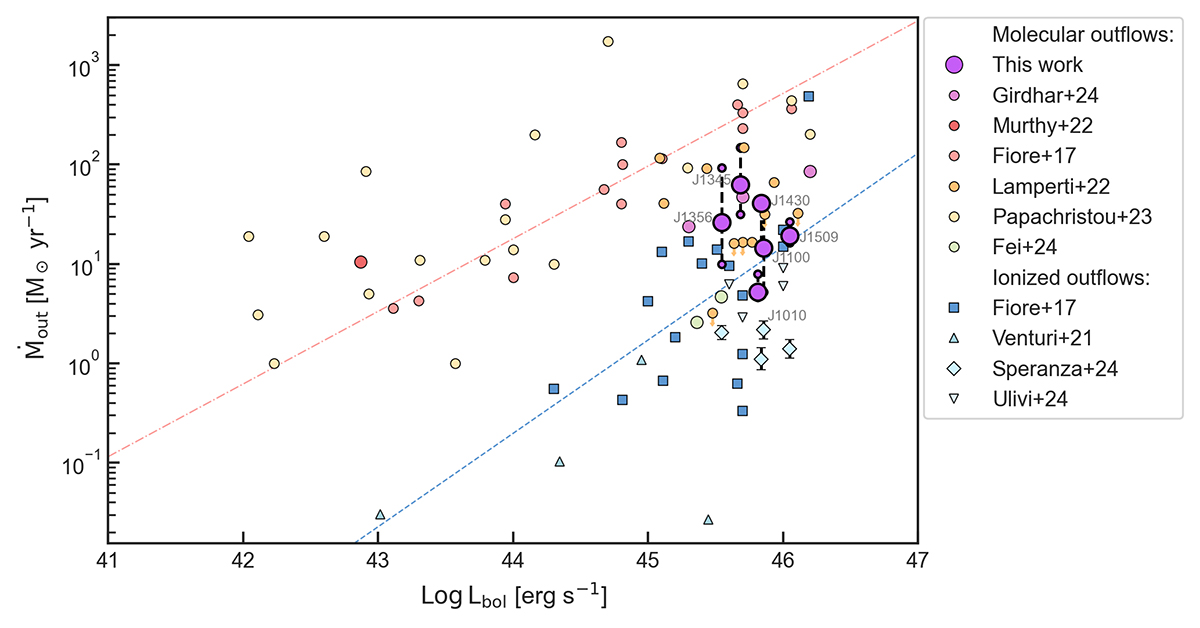
Outflow rate vs. bolometric luminosity. The molecular outflow mass rates derived for the QSO2s using the three scenarios are displayed as large purple circles for the intermediate value, and dashed black lines connecting the most and least conservative values (small purple circles). For comparison, we included other molecular mass outflow rates measurements from the literature as circles of different colors: AGN and ULIRGs from Fiore et al. (2017), QSO2s from Girdhar et al. (2024), two type-1 QSOs from Fei et al. (2024), AGN-dominated ULIRGs from Lamperti et al. (2022), AGN with possibly jet-driven outflows from Papachristou et al. (2023), and the low-power jet-driven outflow from Murthy et al. (2022). Mass outflow rates reported for ionized outflows in the literature are shown with different symbols and shades of blue: AGN and ULIRGs from Fiore et al. (2017) as squares, local jetted-Seyfert galaxies from Venturi et al. (2021) as upward triangles, QSO2s at z < 0.4 from Ulivi et al. (2024) as downward triangles, and four of the QSO2s studied here from Speranza et al. (2024) as diamonds. The corresponding linear fits from Fiore et al. (2017) are shown as a salmon dot-dashed line for molecular outflows and as a blue dashed line for the ionized ones. The mass outflow rates from the literature have been converted to the thin shell geometry adopted in this work when necessary.
Current usage metrics show cumulative count of Article Views (full-text article views including HTML views, PDF and ePub downloads, according to the available data) and Abstracts Views on Vision4Press platform.
Data correspond to usage on the plateform after 2015. The current usage metrics is available 48-96 hours after online publication and is updated daily on week days.
Initial download of the metrics may take a while.