Fig. 8.
Download original image
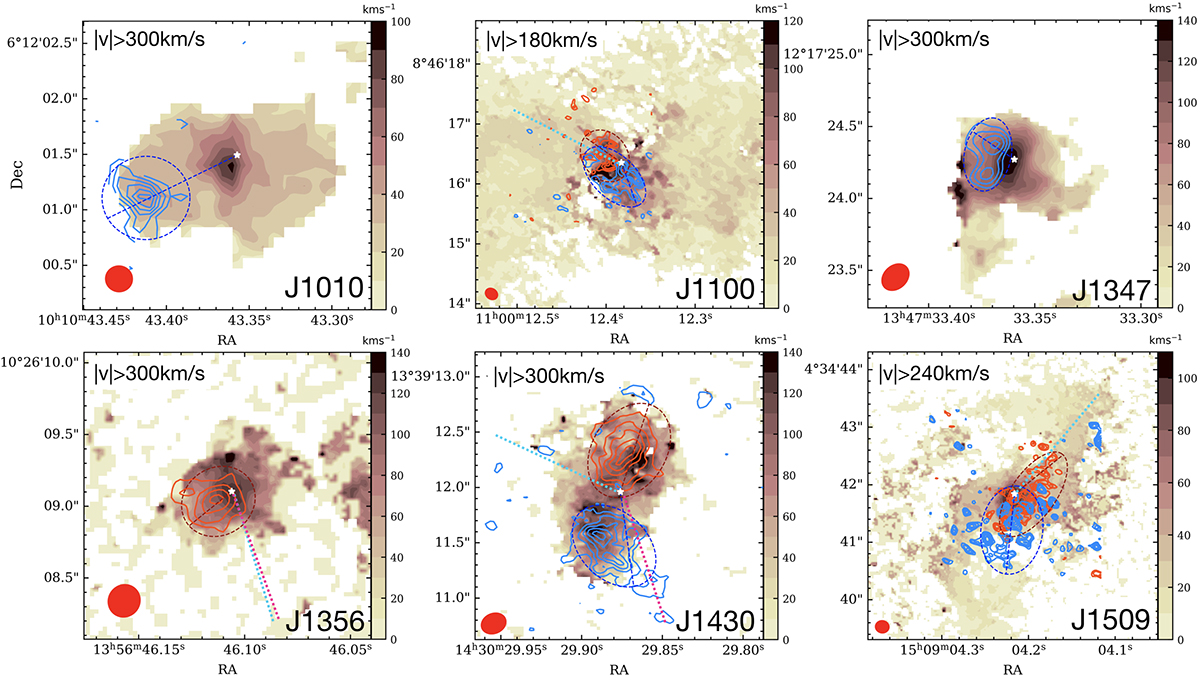
High-velocity flux maps overlaid on the CO velocity dispersion maps for the six QSO2s. The color maps corresponds to the moment 2 of the total CO(2–1) emission at 0![]() 2 resolution for all the QSO2s except for J1010, for which CO(3–2) at the same angular resolution is shown instead. The color bars are in km s−1 units. The contributions from the high velocity gas above (below) the velocity value indicated on the top left corner of each panel are shown as red (blue) contours at (0.35,0.5,0.65,0.8,0.95)×σmax. The beam size is indicated with a red ellipse in the bottom left corner of each panel. Ellipses were fitted to the high-velocity gas to determine the orientation of the blueshifted and redshifted outflows, and they are shown with corresponding colors. The dashed lines connecting the galaxy nucleus, defined by the 200 GHz continuum peak (white star), and the most distant point within the ellipse were used to estimate the PA of the outflows. For comparison, the PA of the redshifted and blueshifted sides of the ionized outflows detected in [OIII] by Speranza et al. (2024) are indicated with magenta and cyan dotted lines.
2 resolution for all the QSO2s except for J1010, for which CO(3–2) at the same angular resolution is shown instead. The color bars are in km s−1 units. The contributions from the high velocity gas above (below) the velocity value indicated on the top left corner of each panel are shown as red (blue) contours at (0.35,0.5,0.65,0.8,0.95)×σmax. The beam size is indicated with a red ellipse in the bottom left corner of each panel. Ellipses were fitted to the high-velocity gas to determine the orientation of the blueshifted and redshifted outflows, and they are shown with corresponding colors. The dashed lines connecting the galaxy nucleus, defined by the 200 GHz continuum peak (white star), and the most distant point within the ellipse were used to estimate the PA of the outflows. For comparison, the PA of the redshifted and blueshifted sides of the ionized outflows detected in [OIII] by Speranza et al. (2024) are indicated with magenta and cyan dotted lines.
Current usage metrics show cumulative count of Article Views (full-text article views including HTML views, PDF and ePub downloads, according to the available data) and Abstracts Views on Vision4Press platform.
Data correspond to usage on the plateform after 2015. The current usage metrics is available 48-96 hours after online publication and is updated daily on week days.
Initial download of the metrics may take a while.