Fig. 4.
Download original image
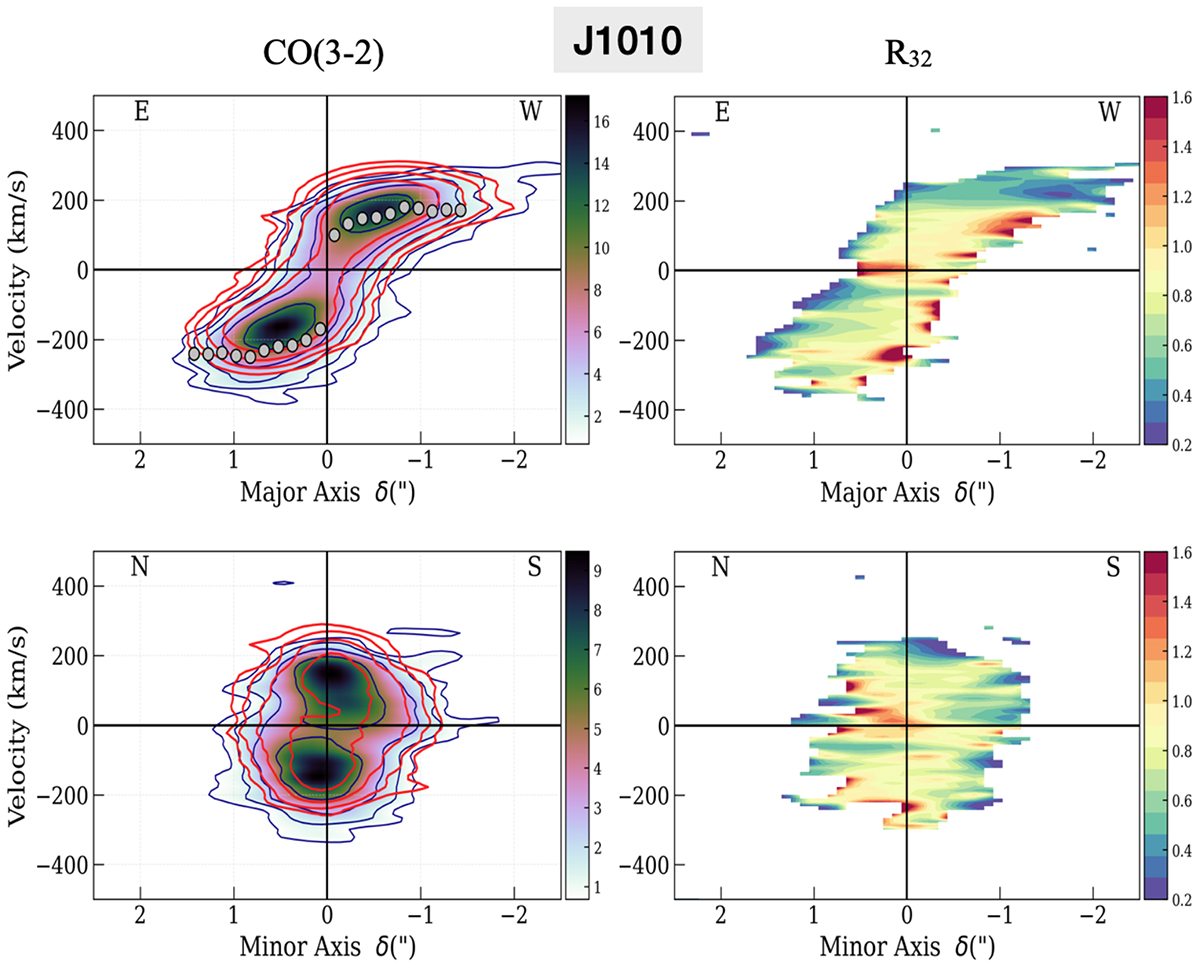
Position-velocity diagrams along the major (top panels) and minor (bottom panels) axis of the of the CO(3–2) emission (left) and the R32 line ratios (right) for J1010. The PVDs were extracted in a slit of 0![]() 6 width along the major (PA = 288°) and minor (PA = 198°) axis of the CO disk and are displayed above 2σrms. The contours are 2, 4, 8, and 16σrms, with σrms = 0.3 mJy beam−1 for CO(3–2) in the left panels. The red contours shown in the left and middle panels correspond to the corresponding 3DBAROLO model at 2, 4, and 6σrms, and the grey dots are the derived rotation velocities. Right panels are the PVDs of the CO(3–2)/CO(2–1) line ratios. The color bars correspond to flux density in mJy for the CO(3–2) PVDs and brightness temperature ratio R32, which is dimensionless.
6 width along the major (PA = 288°) and minor (PA = 198°) axis of the CO disk and are displayed above 2σrms. The contours are 2, 4, 8, and 16σrms, with σrms = 0.3 mJy beam−1 for CO(3–2) in the left panels. The red contours shown in the left and middle panels correspond to the corresponding 3DBAROLO model at 2, 4, and 6σrms, and the grey dots are the derived rotation velocities. Right panels are the PVDs of the CO(3–2)/CO(2–1) line ratios. The color bars correspond to flux density in mJy for the CO(3–2) PVDs and brightness temperature ratio R32, which is dimensionless.
Current usage metrics show cumulative count of Article Views (full-text article views including HTML views, PDF and ePub downloads, according to the available data) and Abstracts Views on Vision4Press platform.
Data correspond to usage on the plateform after 2015. The current usage metrics is available 48-96 hours after online publication and is updated daily on week days.
Initial download of the metrics may take a while.