Fig. 3.
Download original image
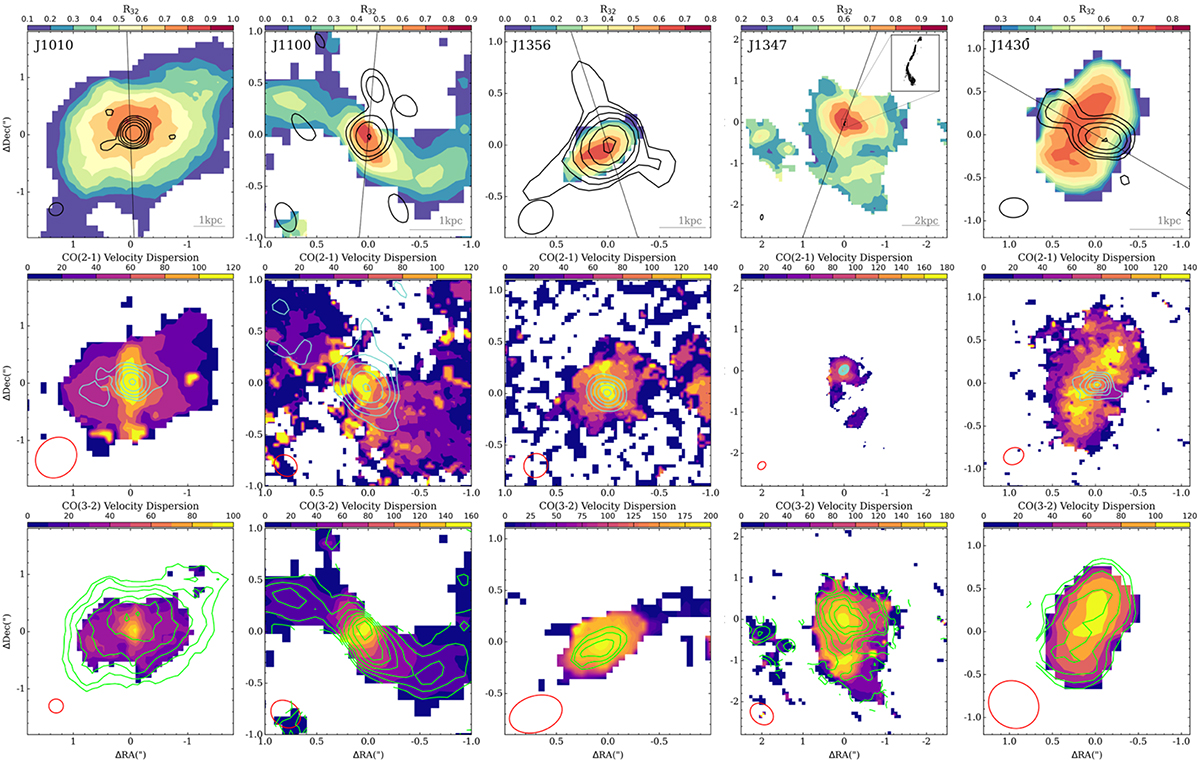
Brightness temperature ratio R32 and CO(2–1) and CO(3–2) velocity dispersion maps. The top panels show the R32 map at the coarser resolution of either CO(2–1) or CO(3–2), with the VLA 6 GHz HR contours overlaid in black (at 4, 8, 16, 32, and 64σrms, with σrms listed in Table A.1 in the appendix, also in Table 3 of Jarvis et al. 2019). For J1100 we present the e-MERLIN observations at 1.5 GHz at a 0![]() 3 resolution presented in Jarvis et al. (2019) and for J1347 we show in the inset box the 100 pc scale jet seen with VLBA data at 15 GHz (Kellermann et al. 2004). The beam size of the radio observations are indicated as black ellipses on the bottom left corner of the top panels. For J1347, the beam size of the VLBA data is multiplied by a factor of 100 for display purposes. PAjet from Jarvis et al. (2019) are indicated as black solid lines (values are listed in Table 6). In J1010 and J1356, PAjet was determined by these authors from the radio emission detected at larger scales in the low-resolution radio images. The middle and bottom panels correspond to the velocity dispersion maps of CO(2–1) and CO(3–2), respectively. The deepest ALMA continuum images are overlaid as cyan contours in the middle panels: at 300 GHz for J1010 and J1100 and at 200 Ghz for J1356, J1347, and J1430. The red ellipses in the bottom left corner of the velocity dispersion maps indicate the corresponding beam sizes. Green contours on the bottom panels are R32 from the top panels.
3 resolution presented in Jarvis et al. (2019) and for J1347 we show in the inset box the 100 pc scale jet seen with VLBA data at 15 GHz (Kellermann et al. 2004). The beam size of the radio observations are indicated as black ellipses on the bottom left corner of the top panels. For J1347, the beam size of the VLBA data is multiplied by a factor of 100 for display purposes. PAjet from Jarvis et al. (2019) are indicated as black solid lines (values are listed in Table 6). In J1010 and J1356, PAjet was determined by these authors from the radio emission detected at larger scales in the low-resolution radio images. The middle and bottom panels correspond to the velocity dispersion maps of CO(2–1) and CO(3–2), respectively. The deepest ALMA continuum images are overlaid as cyan contours in the middle panels: at 300 GHz for J1010 and J1100 and at 200 Ghz for J1356, J1347, and J1430. The red ellipses in the bottom left corner of the velocity dispersion maps indicate the corresponding beam sizes. Green contours on the bottom panels are R32 from the top panels.
Current usage metrics show cumulative count of Article Views (full-text article views including HTML views, PDF and ePub downloads, according to the available data) and Abstracts Views on Vision4Press platform.
Data correspond to usage on the plateform after 2015. The current usage metrics is available 48-96 hours after online publication and is updated daily on week days.
Initial download of the metrics may take a while.