Fig. 2.

Download original image
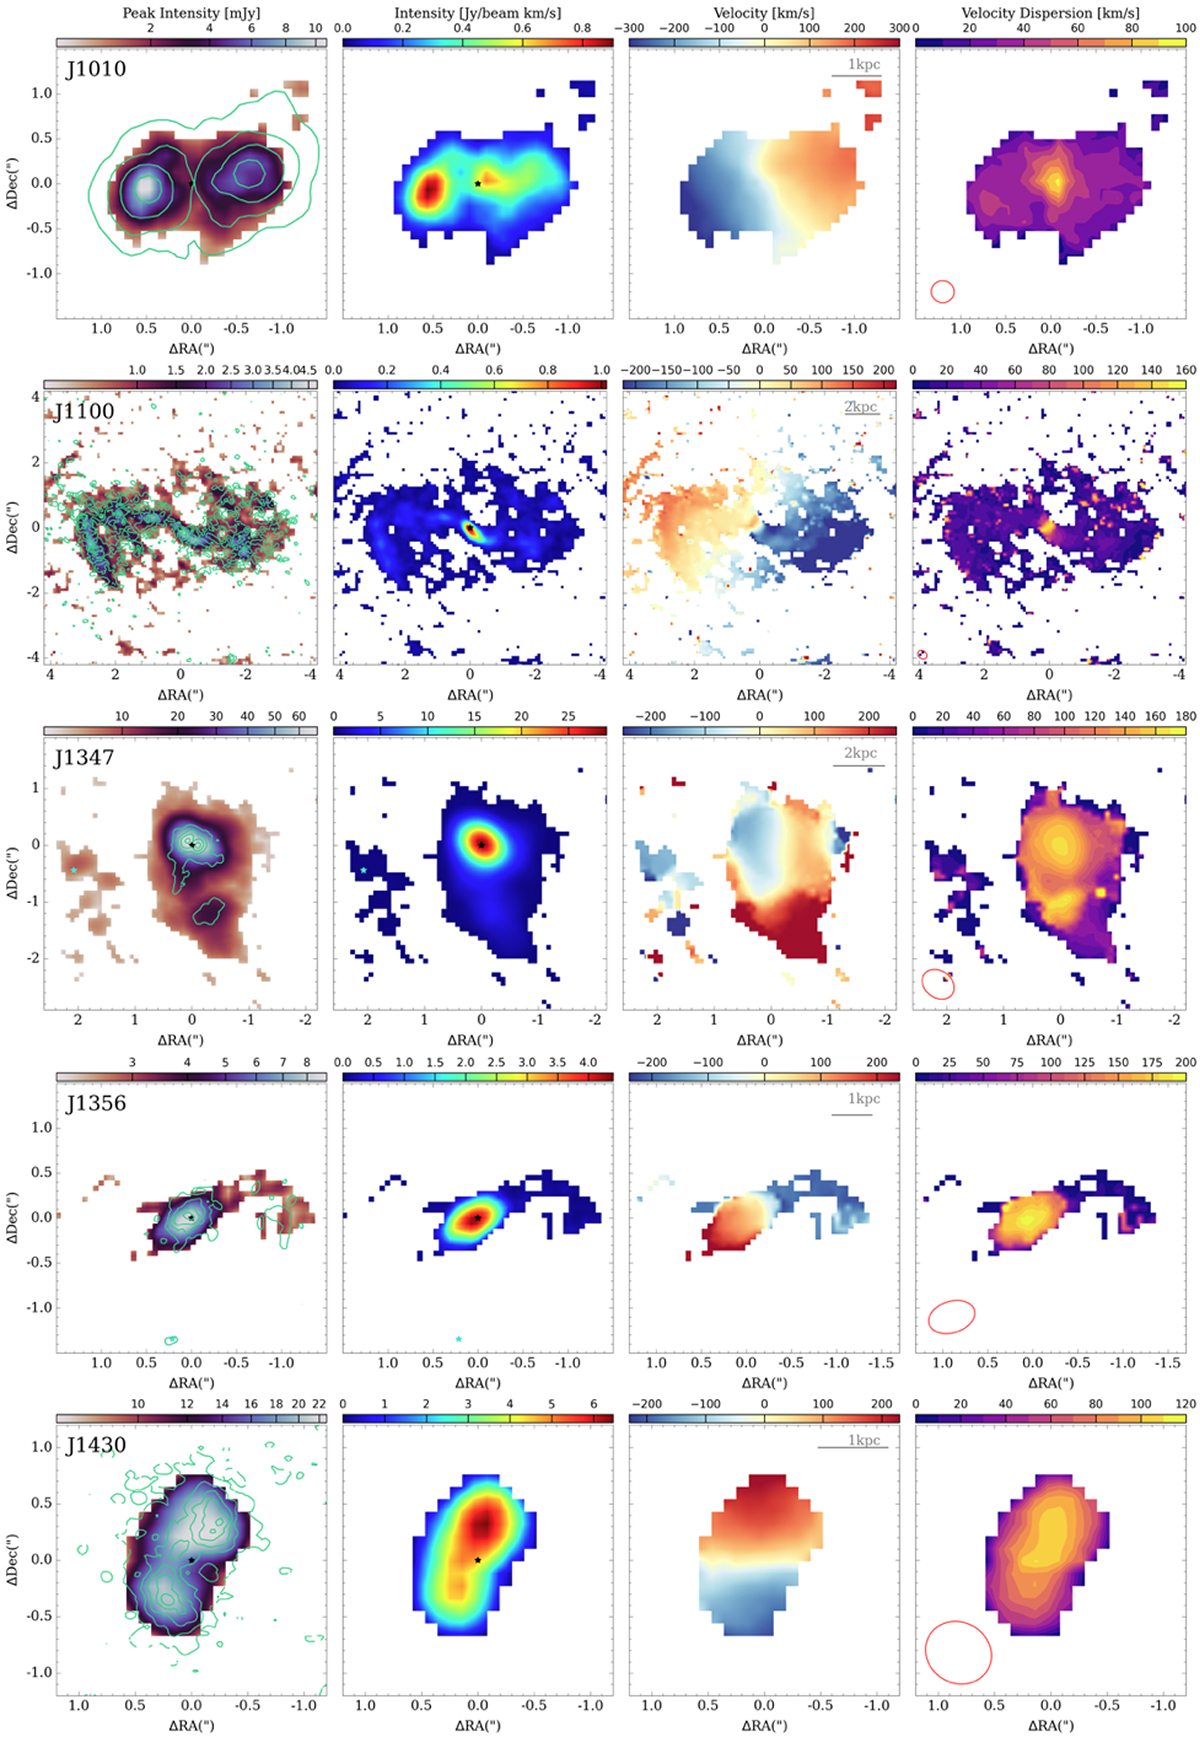
Moment maps of the CO(3–2) emission for the QSO2s. From left to right, the panels correspond to the peak intensities (in mJy units), the integrated intensity (moment 0, in Jy beam−1 km s−1 units), the intensity-weighted velocity field (moment 1, in km s−1), and the velocity dispersion (moment 2, in km s−1), respectively. East is to the left, and north is up. The red ellipses in the bottom left corner of the velocity dispersion maps indicate the beam sizes. The black stars show the nuclei, defined as the peak of the 220 GHz continuum as in RA22. For the cases of J1347 and J1356, a secondary nucleus (blue star) is identified in the optical and/or with ALMA continuum to the East and South directions, respectively. Green contours on the left panels indicate the ∼0![]() 2 (0
2 (0![]() 8 in the case of J1010) resolution CO(2–1) peak distribution shown in Figure 1 for comparison. The gray horizontal lines indicate the physical sizes.
8 in the case of J1010) resolution CO(2–1) peak distribution shown in Figure 1 for comparison. The gray horizontal lines indicate the physical sizes.
Current usage metrics show cumulative count of Article Views (full-text article views including HTML views, PDF and ePub downloads, according to the available data) and Abstracts Views on Vision4Press platform.
Data correspond to usage on the plateform after 2015. The current usage metrics is available 48-96 hours after online publication and is updated daily on week days.
Initial download of the metrics may take a while.


